On November 4th and 5th, BigML joined the Qatar Computing Research Institute (QCRI), part of Hamad Bin Khalifa University, to bring a Machine Learning School to Doha, Qatar! We are very excited to have this opportunity to collaborate with QCRI.
During the conference, Dr. Sanjay Chawla discussed his algorithm for clustering with anomalies, k-means–. We thought it would be a fun exercise to implement a variation of it using our domain-specific language for automating Machine Learning workflows, WhizzML.
The Algorithm
The usual process for the k-means– algorithm is as follows. It starts with some dataset, some number of clusters k, and some number of expected outliers l. It randomly picks k centroids, and assigns every point of the dataset to one of these centroids based on which one is closest. So far, it’s just like vanilla k-means. In vanilla k-means, you would now find the mean of each cluster and set that as the new centroid. In k-means–, however, you first find the l points which are farthest from their assigned centroids and filter them from the dataset. The new centroids are found using the remaining points. By removing these points as we go, we’ll find centroids that aren’t influenced by the outliers, and thus different (and hopefully better) centroids.
We already have an implementation of k-means in BigML, the cluster resource. But this is not vanilla k-means. Instead of finding the new centroids by averaging all of the points in the cluster, BigML’s implementation works faster by sampling the points and using a gradient descent approach. BigML also picks better initial conditions than vanilla k-means. Instead of losing these benefits, we’ll adapt Chawla’s k-means– to use a full BigML clustering resource inside the core iteration.
This WhizzML script is the meat of our implementation.
(define (get-anomalies ds-id filtered-ds k l)
  (let (cluster-id (create-and-wait-cluster {"k" k
                                             "dataset" filtered-ds})
        batchcentroid-id (create-and-wait-batchcentroid
                            {"cluster" cluster-id
                             "dataset" ds-id
                             "all_fields" true
                             "distance" true
                             "output_dataset" true})
        batchcentroid (fetch batchcentroid-id)
        centroid-ds (batchcentroid "output_dataset_resource")
        sample-id (create-and-wait-sample centroid-ds)
        field-id (((fetch centroid-ds) "objective_field") "id")
        anomalies (fetch sample-id {"row_order_by" (str "-" field-id)
                                    "mode" "linear"
                                    "rows" l
                                    "index" true}))
    (delete* [batchcentroid-id sample-id])
    {"cluster-id" cluster-id
     "centroid-ds" centroid-ds
     "instances" ((anomalies "sample") "rows")}))
Let’s examine it line by line. Instead of removing l outliers at each step of the algorithm, let’s run an entire k-mean sequence before removing our anomalies.
cluster-id (create-and-wait-cluster {"k" k "dataset" filtered-ds})
It is very easy to then create a batch centroid with an output dataset with distance to the centroid appended.
batchcentroid-id (create-and-wait-batchcentroid {"cluster" cluster-id
                                                 "dataset" ds-id
                                                 "all_fields" true
                                                 "distance" true
                                                 "output_dataset"
                                                   true})
To get specific points, we need to use a BigML sample resource to get the most distant points.
sample-id (create-and-wait-sample centroid-ds)
We can now find the distance associated with the lth instance, and subsequently filter out all points greater than that distance from our original dataset.
anomalies (fetch sample-id {"row_order_by" (str "-" field-id)
                            "mode" "linear"
                            "rows" l
                            "index" true}))
We repeat this process until the centroid stabilizes, as determined by passing a threshold for the Jaccard coefficient between the sets of outliers in subsequent iterations of the algorithm, or until we reach some maximum number of iterations set by the user.
You can find the complete code on GitHub or in the BigML gallery.
The Script In Action
So what happens when we run this script? Let’s try it with the red wine quality dataset. Here is the result when using a k of 13 (chosen using a BigML g-means cluster) and an l of 10.
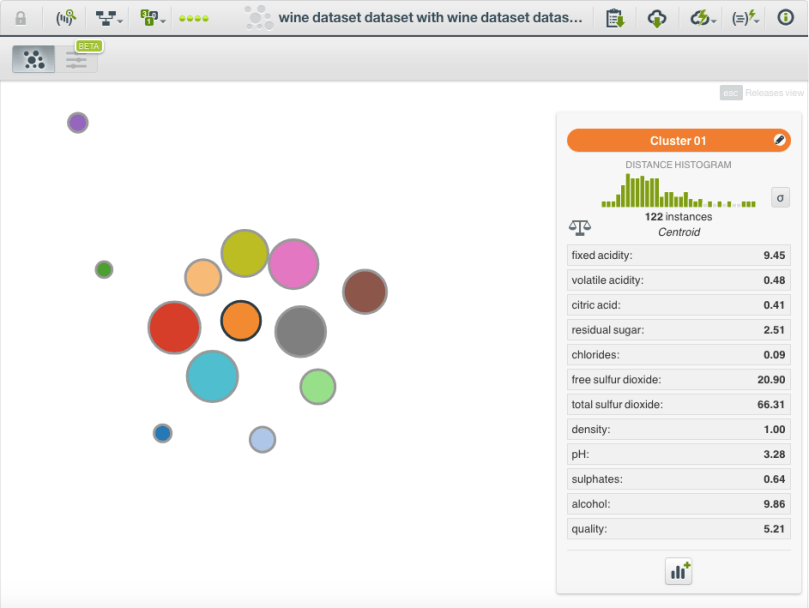
We can export a cluster summary report and compare it to a vanilla BigML cluster with the same k. As you might expect by removing the outlying points, the average of the centroid standard deviations is smaller for the k-means minus two results: 0.00128 versus 0.00152.
What about the points we removed as outliers? Do we know if they were truly anomalous? When we run the wine dataset through a BigML anomaly detector, we can get the top ten anomalies according to an isolation forest. When compared to the ten outliers found by the script, we see that there are six instances in common. This is a decent agreement that we have removed true outliers.
We hope you enjoyed this demonstration of how BigML can work with research to easily custom-make ML algorithms. If you couldn’t join us in Doha this weekend, we hope to see you at the first of our ML School in Seville, Spain, and other upcoming events!

Reblogged this on BLACK BOX PARADOX and commented:
A data cluster is a group of objects that are more similar to each other than to those in other groups. Learn here about K-means clustering technique and how to use it for (unsupervised) anomaly detection.