Data preparation is a key task in any Machine Learning workflow, but it’s often one of the most challenging and time-consuming parts. BigML’s upcoming release brings new data transformation features that make it faster and easier than ever before to get your data ready for Machine Learning.
![]()
These features significantly expand the data preparation options that BigML already provides, such as missing values treatment, categorical values encoding, date-time fields expansion or NLP techniques for your text fields.
All the new data transformation features can be classified into two groups:
- SQL queries: The capability of writing SQL queries to create new datasets opens up an infinite number of transformations to prepare your data for Machine Learning. Although the ability to freely write SQL statements will be an API-only feature for now, we are bringing some common transformations to the Dashboard for users that prefer to transform their data in a few clicks: aggregate instances, join and merge datasets. The idea is to add more options in the Dashboard on an ongoing basis; for example, the ability to order instances and remove duplicates. Please send an e-mail to roadmap@bigml.com if you have any particular request.
- Feature engineering: new sliding windows feature, and significant improvements to the Flatline Editor, enabling more ways to easily create fields for your datasets.
Aggregating Instances
The aggregating instances option in BigML allows you to group the rows of a dataset by a given field.
For example, imagine you have customer data stored in a dataset where each purchase is a different row. If you want to use this dataset to train models to analyze customers purchase behaviors, you need a dataset where each row is a customer instead of a purchase. This is the case of the dataset in the image below where we can aggregate the instances by the field “customerID” to get a row per unique customer. You can also see that we needed to use some aggregation functions for the rest of the fields in order to add them to the new dataset such as the total purchases per customer (“Count_customerID”), the total units purchased (“Sum_Quantity”), the first purchase date (“Min_Date”) or the average price per unit spent per customer (“Avg_UnitPrice”).

You can easily do this on the BigML Dashboard by following these steps:
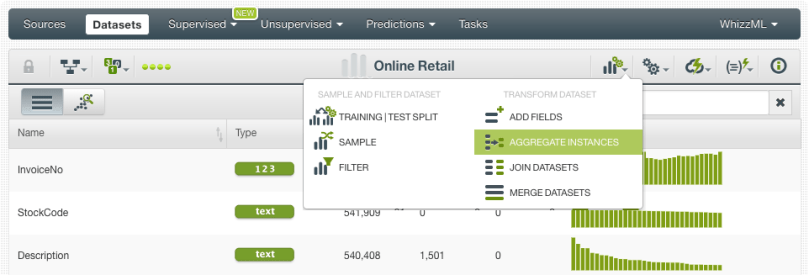
- Click the “Aggregate instances” option from the dataset configuration menu:
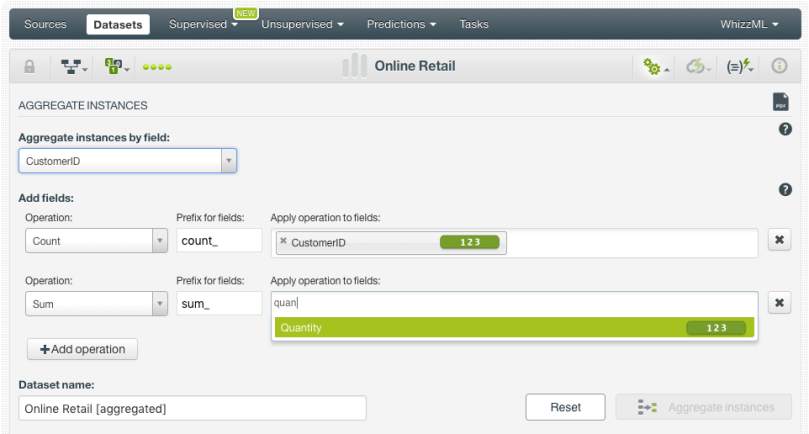
- Select the “CustomerID” as the grouping field:

- Configure the aggregation operations for the fields you want to include in the final dataset. For example, in the image below we are including the count of rows per customer and the total amount of units purchased:
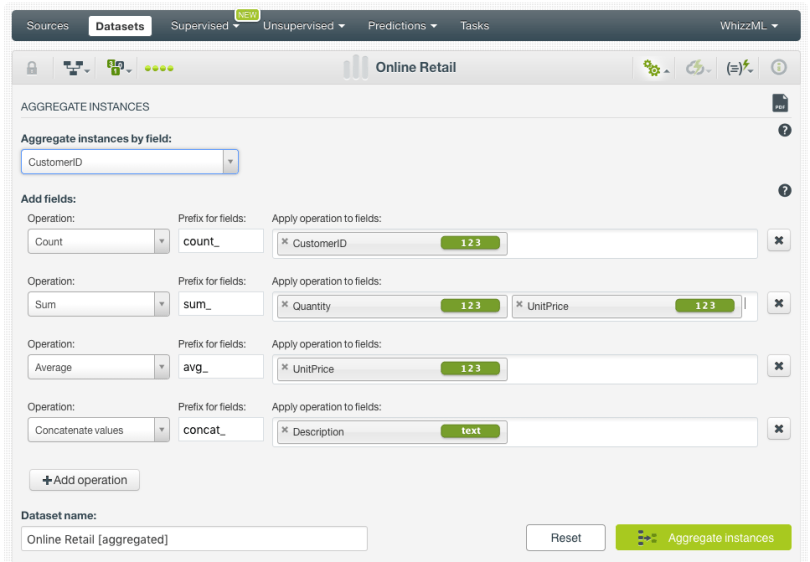
- When you have all the operations defined, click on the “Aggregate instances” button:
This will create a new dataset containing a customer per row and the columns that you defined using the aggregation functions described above. From this dataset, you can also see the SQL query under the hood by clicking the option highlighted in the image below.

Joining Datasets
BigML allows you to join several datasets to combine their fields and instances based on one or more related fields between them. This is very useful when your data is scattered in two or more datasets.
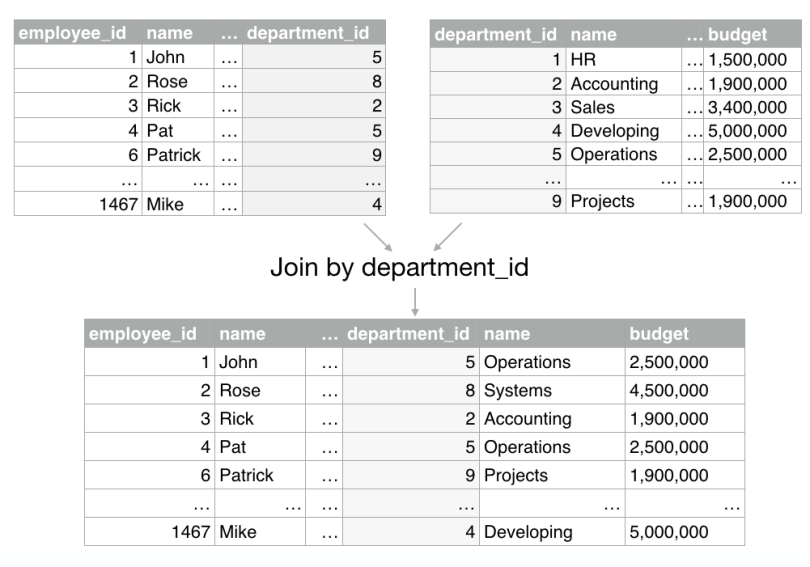
For example, imagine we want to predict employee performance and we have two different sources of data: a dataset containing employees’ data (employee name, salary, age, etc.) and another dataset containing departments data (department name, budget, etc.). If we want to include the department data as an additional predictor for our employees’ analysis, we can use a common field in both datasets (department_id) to add the department characteristics to the employee dataset (see image below).
You can easily do this on the BigML Dashboard by following these steps:
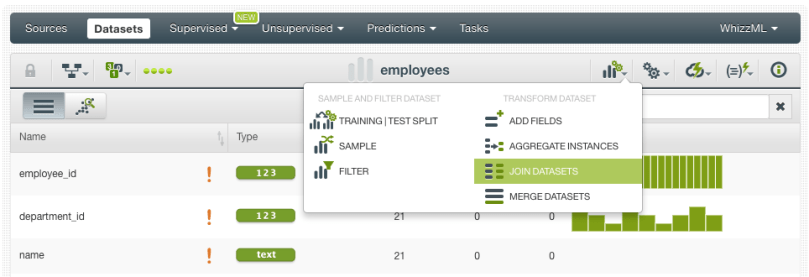
- Click the “Join datasets” option from the dataset configuration menu:
- Then select the type of join: left join if you want to get all the instances from the current (left) dataset and the matched instances from the selected (right) dataset; or inner join if you want to get the instances that have matching values in both datasets. In this case, we are selecting the left join because we want all the employees regardless if they have a matching department or not. Next, select the dataset you want to make the join with:

- Select one or more pairs of joining fields to match the instances of both datasets. In this example, we select the department_id to make the match:
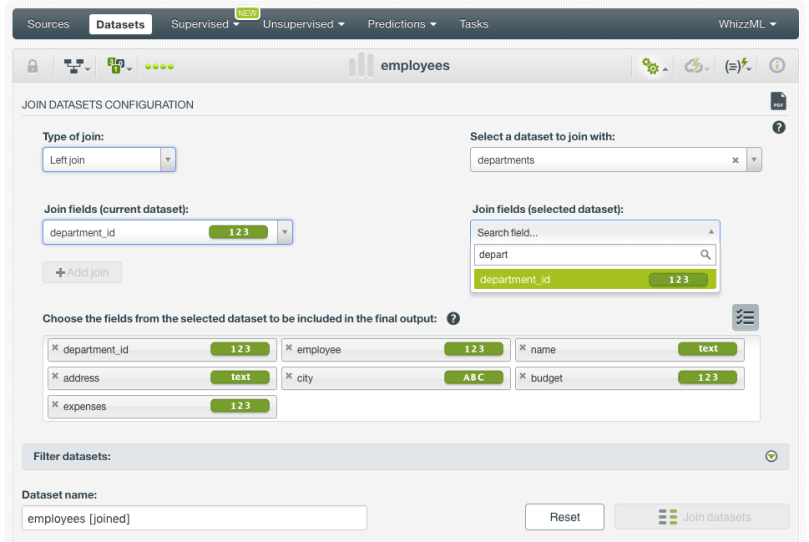
- Decide which fields of the selected dataset (the departments dataset in our case) you want to include in the final joined dataset:
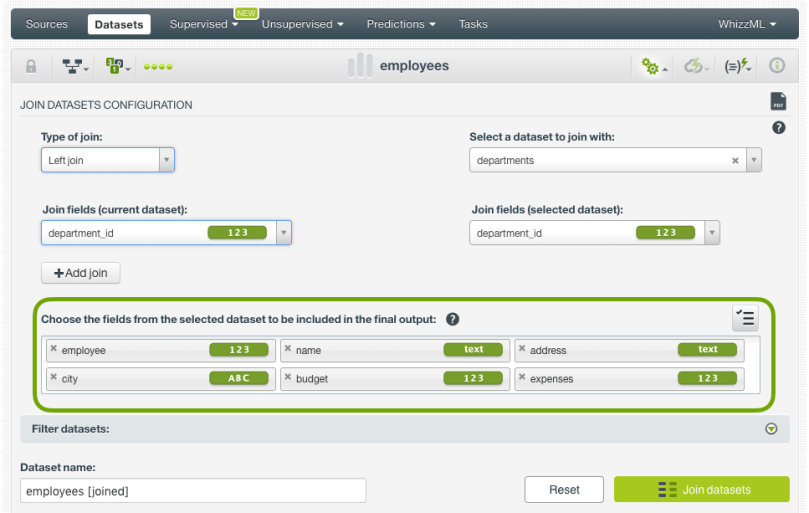
- Optionally, you can filter the joined dataset by selecting fields from the current or the selected dataset and setting up different filtering conditions. Then go ahead and click the “Join datasets” button.

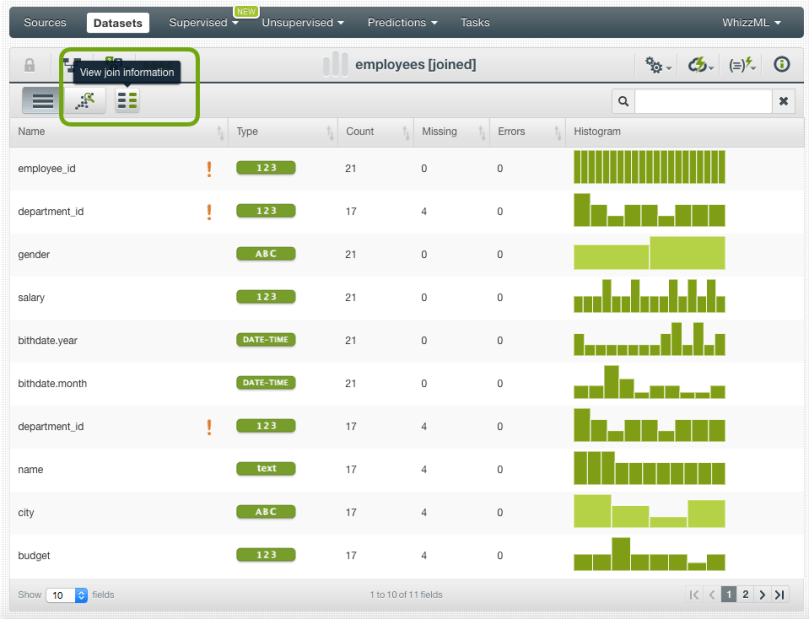
This will create a dataset that will contain the matched instances and fields from both datasets. From this dataset, you can also see the SQL query under the hood by clicking the option highlighted in the image below.
Merging Datasets
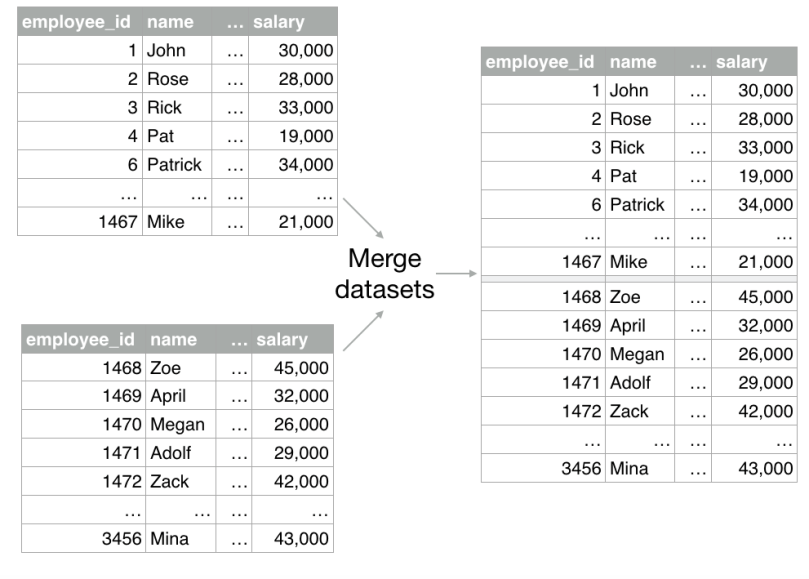
The merging datasets option in BigML allows you to include the instances of several datasets in one dataset.
This functionality can be very useful when you use multiple sources of data. For example, imagine we have employees data in two different datasets and we want to merge them into one dataset.
You can easily do this on the BigML Dashboard by following these steps:
- Click the “Merge datasets” option from the dataset configuration menu:

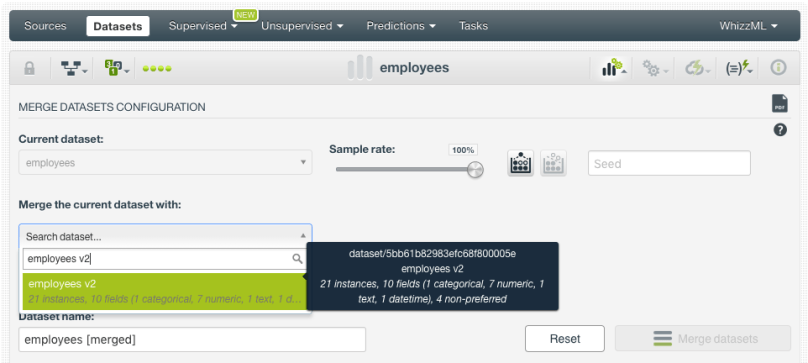
- Select the datasets you want to merge. The datasets should have the same fields so the instances of one dataset can be added after the instances of the other dataset. You can select up to 32 datasets to merge. You can sample each of the datasets selected for the merge by configuring the typical BigML sampling parameters like the percentage rate, replacement, out-of-bag, and seed parameters.
- Click on the “Merge datasets” option:
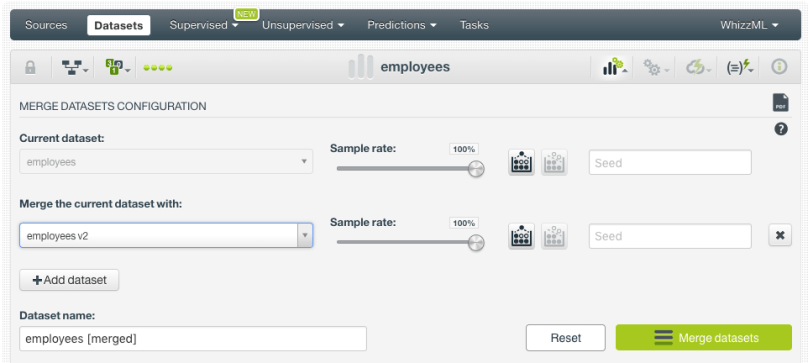
This will create a dataset that will contain the instances from the merged datasets. From this dataset, you can also see the merging information by clicking the option highlighted in the image below.

Feature Engineering
Feature engineering, i.e., the creation of new features that can be better predictors for your models, is one of the most important tasks in Machine Learning because it is usually the biggest source of model improvement. That’s why we also focused our efforts on bringing sliding windows to the BigML Dashboard and improving the Flatline Editor.
Sliding windows
Creating new features using sliding windows is one of the most common feature engineering techniques in Machine Learning. It is usually applied to frame time series data using previous data points as new input fields to predict the next time data points.
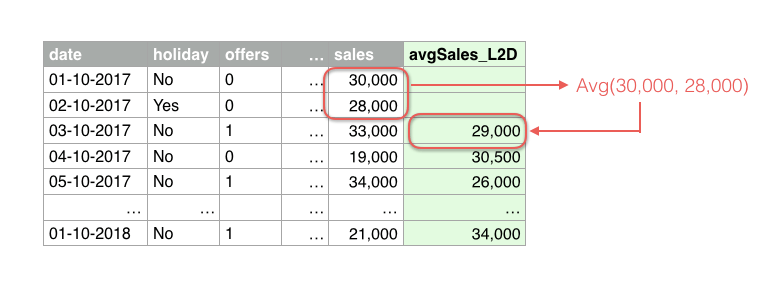
For example, imagine we have one year of sales data to predict sales. As domain experts, we know that past sales can be key predictors to predict today’s sales. Therefore, we can use our objective field “sales” to create additional input fields that contain past data. We can create an infinite number of fields: last day sales, the average of last week sales, the difference between last month and this month sales, etc. In the image below, we are creating a new predictor that calculates the average sales of the last two days (see the field in green “avgSales_L2D”).
This can easily be done on the BigML Dashboard by following these steps:
- Click the “Add fields” option from the dataset configuration menu:
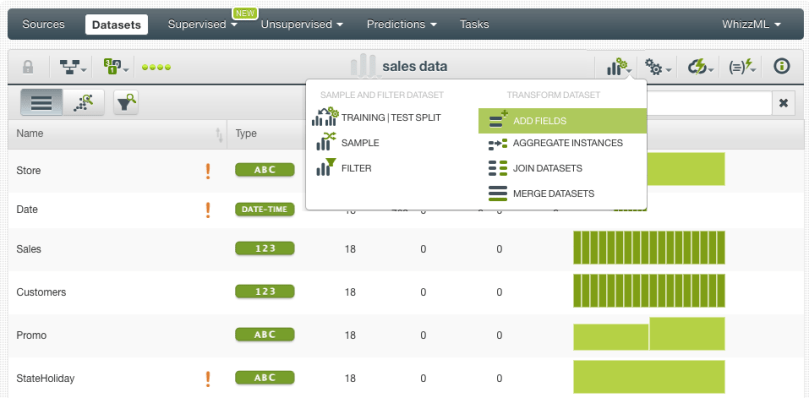
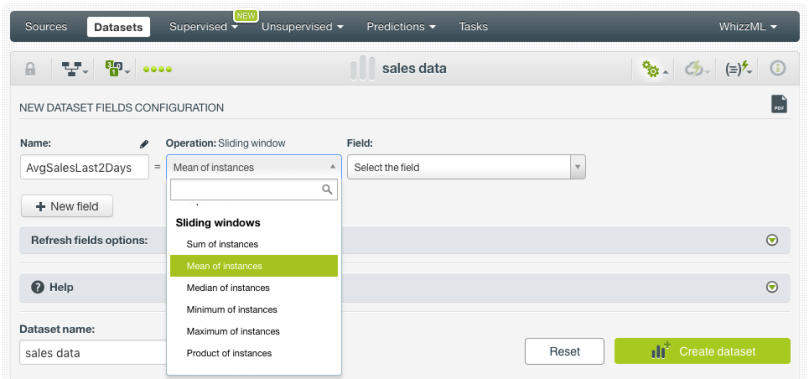
- Select the mean out of the Sliding windows operations in the selector:
- Select the field you want to apply the operation to, a window start -2 and a window end -1 (the window start and end define the first and last instances to be considered for the defined calculation; negative values are previous instances, positive values are next instances, with zero being the current instance). Then click on “Create dataset” button.
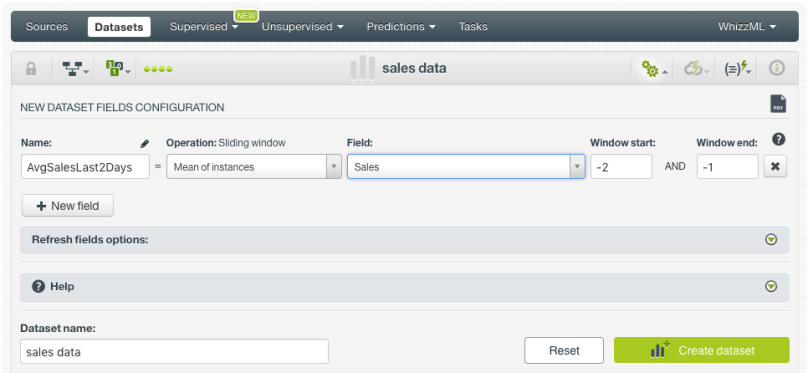
This will create a dataset with a new field that contains the average sales of the last two days and can be used as a new predictor.
Flatline Editor Improvements
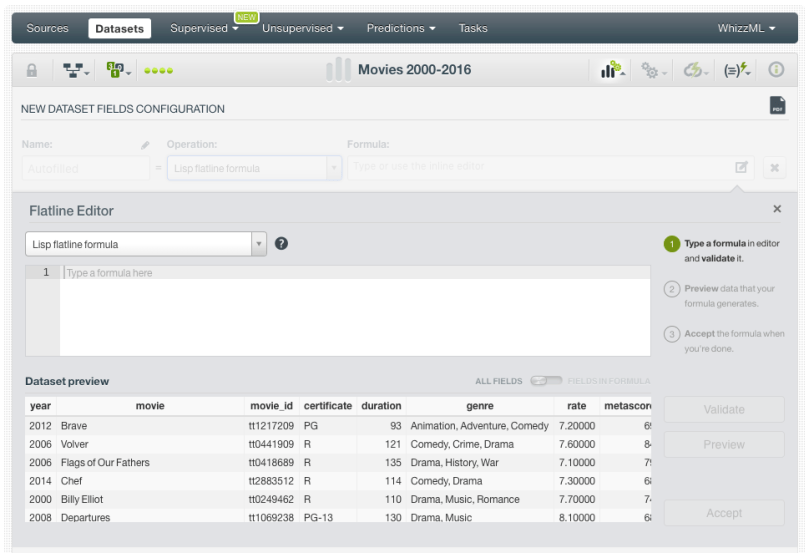
The Flatline editor allows you to easily create new fields for your dataset by using BigML’s domain-specific language Flatline. You can access the editor by selecting the option “Add fields” from the dataset configuration menu, then select the Flatline formula operation and click on the editor icon (see image below).

You can see that the dataset preview now includes a table view where you can easily see a sample of your instances.
When you write a formula and you want to view its result, the preview only shows the fields involved in the formula. That way you can easily check if your formula is being calculated correctly. For example in the image below, you can see only two fields in the preview, the one used in the formula as input (the field “duration”) and the new field result of the formula (if the duration of the movie is higher than 100 minutes it is classified as “long”, otherwise it is “short”). You can also change this view to show all the dataset fields again using the green switcher on top of the table preview.

Want to know more about Data Transformations?
Stay tuned for the next blog post to learn how to perform data transformations with SQL via the BigML API. If you have any questions or you would like to learn more about how Data Transformations work, please visit the release page. It includes a series of blog posts, the BigML Dashboard and API documentation, the webinar slideshow, as well as the full webinar recording.
