BigML is bringing Boosted Trees to our ever-growing suite of supervised learning techniques. Boosting is a variation on ensembles that aims to reduce bias, potentially leading to better performance than Bagging or Random Decision Forests.
In our first blog post of this series of six posts about Boosted Trees, we saw a gentle introduction to Boosted Trees to get some context about what this new resource is and how it can help you solve your classification and regression problems. This post will take us further, into the detailed steps of how to use boosting with BigML.

Step 1: Import Your Data
To learn from our data, we must first upload it. There are several ways to upload your data to BigML. The easiest is to navigate to the Dashboard and click on the sources tab on the far left. From there you can create a source by importing from Google Drive, Google Storage, Dropbox, MS Azure. If your dataset is not terribly large, creating an inline source by directly typing in the data may appeal to you. You can also create a source from a remote URL, or by uploading a local file (of format .csv, .tsv, .txt, .json, .arff, .data, .gz, or .bz2).

Step 2: Create Your Dataset
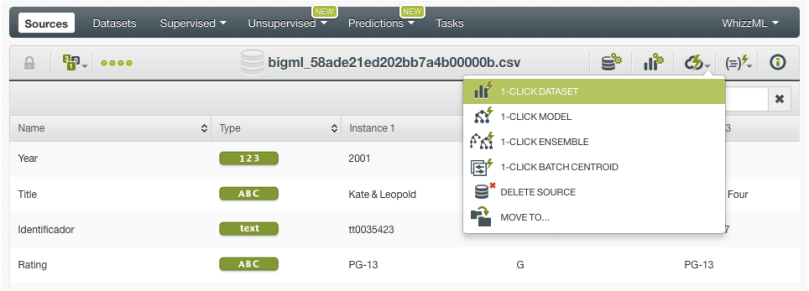
Once a file is uploaded as a source, it can be turned into a dataset. From your Source view, use the 1-click Dataset option to create a dataset, a structured version of your data ready to be used by a Machine Learning algorithm.
In the dataset view, you will be able to see a summary of your field values, some basic statistics and the field histograms to analyze your data distributions. This view is really useful to see any errors or irregularities in your data. You can filter the dataset by several criteria and even create new fields from your existing data.

Once your data is free of errors you will need to split your dataset into two different subsets: one for training your Boosted Trees, and the other for testing. It is crucial to train and evaluate supervised learning models with different data to get a true evaluation and not be tricked by overfitting. You can easily split your dataset using the BigML 1-click option or the configure option menu, which randomly splits 80% of the data for training and sets aside 20% for testing.

Step 3: Create Your Boosted Trees
To create Boosted Trees, make sure you are viewing the training split of your dataset, click on Configure Ensemble under the configure option menu. By default, the last field of your dataset is chosen as the objective field, but you can easily change this with the dropdown on the left. To enable boosting, under Type choose Boosted Trees. This will open up the Boosting tab under Advanced Configuration.

You can, of course, now use the default settings and click on Create Ensemble. But Machine Learning is never at its most powerful without you, the user, bringing your own domain-specific knowledge to the problem. You will get the best results if you ‘turn some knobs’ and alter the default settings to suit your dataset and problem (in a later blog post we’ll discuss automatically finding good parameters).

BigML offers many different parameters to tune. One of the most important is the number of iterations. This controls how many individual trees will be built; one tree per iteration for regression and one tree per class per iteration for classification.
Other parameters that can be found under Boosting include:
- Two forms of early stopping: These will keep the ensemble from performing all the iterations, saving running time and perhaps improving performance. Early Holdout tries to find the optimal stopping time by completely reserving a portion of the data to test at each iteration for improvement, Early Out of Bag simply tests against the out of bag data (data not used in the tree sampling).
- The Learning Rate: Default is 10%, and the learning rate controls how far to step in the gradient direction. In general, a smaller step size will lead to more accurate results, but will take longer to get there.
Another useful parameter to change is found under Tree Sampling:
- The Ensemble Rate option ensures that each tree is only created with a subset of your training data, and generally helps prevent overfitting.
Step 4: Analyze Your Boosted Trees
Once your Boosted Trees are created, the resource view will include a visualization called a partial dependence plot, or PDP. This chart ignores the influence of all but the two fields displayed on the axes. If you want other fields to influence the results, you can select them by checking the box in the input fields section or by making them an axis.

The axes are initially set to the two most important fields. You can change the fields at any time by using the dropdown menus near the X and Y. Each region of the grid is colored based on the class and probability of its prediction. To see the probability in more detail, mouse over the grid and the exact probability appears in the upper righthand area.
Step 5: Evaluate Your Boosted Trees
But how do you know if your parameters are indeed tuned correctly? You need to evaluate your Boosted Trees by comparing its predictions with the actual values seen in your test dataset.

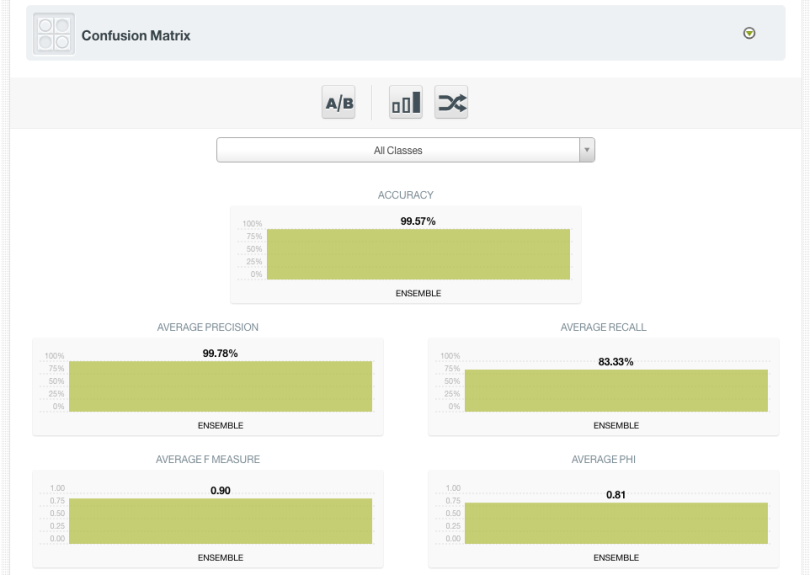
To do this, in the ensemble view click on Evaluate under the 1-click action menu. You can change the dataset to evaluate it against, but the default 20% test dataset is perfect for this procedure. Click on Evaluate to execute and you will see the familiar evaluation visualization, dependent on whether your problem was a classification or regression.
Step 6: Make Your Predictions
When you have results you are happy with, it’s time to make some predictions. Create more Boosted Trees with the parameters set the way you like, but this time run it on the entire dataset. This will mean all your data is informing your decisions.
Boosted Trees differ from our other ensemble predictions because they do not return confidence (for classification) but rather the probabilities for all the classes in the objective field.
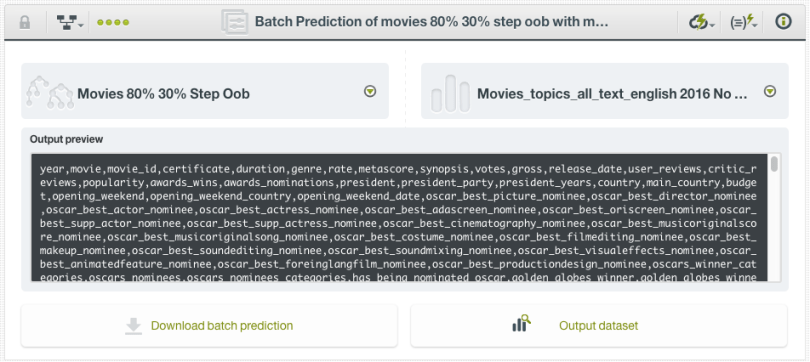
Now you can make a prediction on some new data. Just as with BigML’s previous supervised learning models, you can make a single prediction for just one instance, or a batch prediction for a whole dataset.
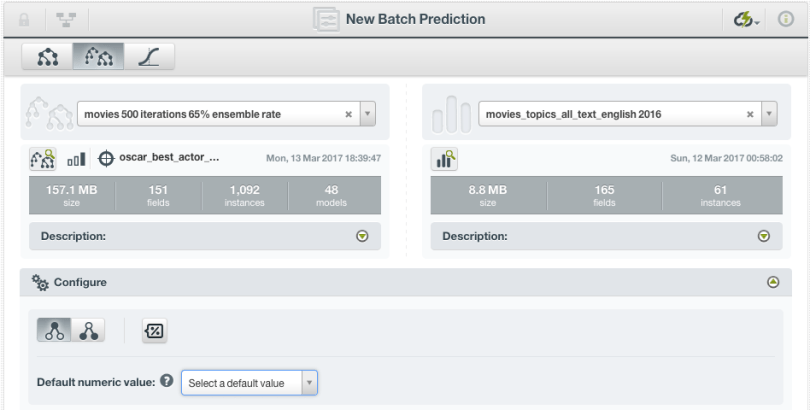
In the ensemble view, click on Prediction (or Batch Prediction) under the 1-click action menu. The left hand side will already have your Boosted Trees. Choose the dataset you wish to run your prediction on from the dropdown on the right. You can, of course, customize the name and prediction output settings. Scroll down to click on Predict to create your prediction.
In the next post, we will see these six steps in action when BigML takes boosting to the Oscars. Stay tuned!
Would you like to find out exactly how Boosted Trees work? Please visit the dedicated release page for more documentation on how to create Boosted Trees, interpret them, and predict with them through the BigML Dashboard and the API; as well as the six blog posts of this series, the slides of the webinar, and the webinar video.

One comment