
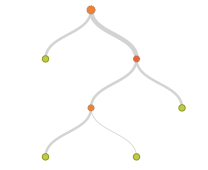
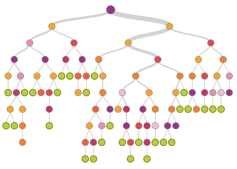
If you’ve built decision trees with BigML or explored our gallery, then you should be familiar with our tree visualizations. They’re a classic and intuitive way to view trees. The root is at the top, its children are the next level down, the grandchildren are deeper still, and so forth.
While intuitive, this sort of visualization does have some drawbacks. Decision trees often grow too wide to comfortably fit the display area. We compensate by collapsing the less important parts of the tree and then letting the user choose where to drill down (either picking specific branches or with our filtering options). It works, and we’re happy with it as our default visualization. But it’s not the only way to look at a decision tree.
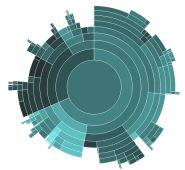
Recently we’ve explored SunBurst tree visualizations as a complement to our current approach. A SunBurst diagram is a little like nested pie charts. Instead of the traditional side view of the decision tree, it’s akin to viewing the tree from the top down. The root of the tree is a circle in the center of diagram and its children wrap around it. The arc length of each child corresponds to the percentage of the training set covered by the child.
We don’t have the visualization ready for production yet, but thanks to the wonderful D3 library and bl.ocks.org from Mike Bostock, we can give you a sneak peek. Below are two ways of viewing a decision tree built on the Iris dataset (the Hello World of machine learning). Click on the images to see either our default visualization or the preview of our SunBurst style.
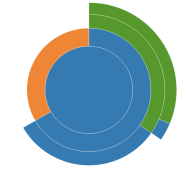
You may have noticed that we do coloring a bit differently with the SunBurst style. In the regular tree viz, we color according to the field each node splits on. In the SunBurst style, we’re experimenting with coloring each node by the most common class. In other words, if you had to make a prediction at that spot in the tree, which class is the best choice? We also give you options if you’d rather see the tree colored by the split field or by prediction confidence.
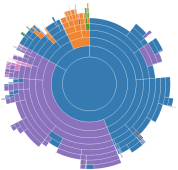
While the Iris model is a fine example for getting used to the view, the SunBurst really shines with larger, more complex trees. Because it is a more space efficient way to layout a tree, we don’t need to worry about filtering or pruning. We can visualize the entire tree, making it easy to spot where the tree focuses on various classes or is most confident of its predictions. The model for the Forest Cover dataset illustrates this well.
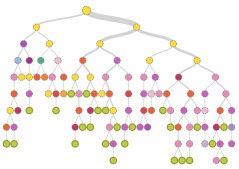
With the traditional view, hovering the mouse over a tree node highlights the decision path to that node. The decision made at every level of the tree is displayed to the right (such as “Elevation > 2706”). With the SunBurst view we also highlight the decision path, but we’ve opted to collapse the individual decisions when showing the criteria for reaching a node (displayed in the lower left corner) . For example, a decision path three levels deep [“Elevation > 2706”, “Elevation > 3062”, “Elevation <= 3303”] might be reduced to a single rule: “3062 < Elevation <= 3303”.
Our new SunBurst view also supports regression trees. The example below shows a model built on the Concrete Compressive Strength dataset. The lighter blues indicate concrete mixes with more strength while darker blues mean weaker mixes.
The SunBurst visualization may not be as immediately intuitive as our regular tree view. Nonetheless we think it will help advanced users get more insight into their trees. We’re looking forward to adding this to BigML, and as always we welcome comments and suggestions!

Reblogged this on gibrown and commented:
Note to self… need to do more data analysis with decision trees. Besides this bigML article, I recently saw a great presentation at a meetup that reminded me of what a great job decision trees do for analyzing features.