BigML’s decision tree visualizations are a powerful way to gain insight into your predictive models. Today, we’re making them even better with enhanced filtering features, enabling you to locate branches and predictions that wouldn’t otherwise be easy to find. If you need a quick overview of the basics of how our decision trees work, please check out this earlier blog post. The new filtering feature is available for your personal BigML models, and is also available for any given model in our gallery.

Filter by Support, Prediction, and Confidence
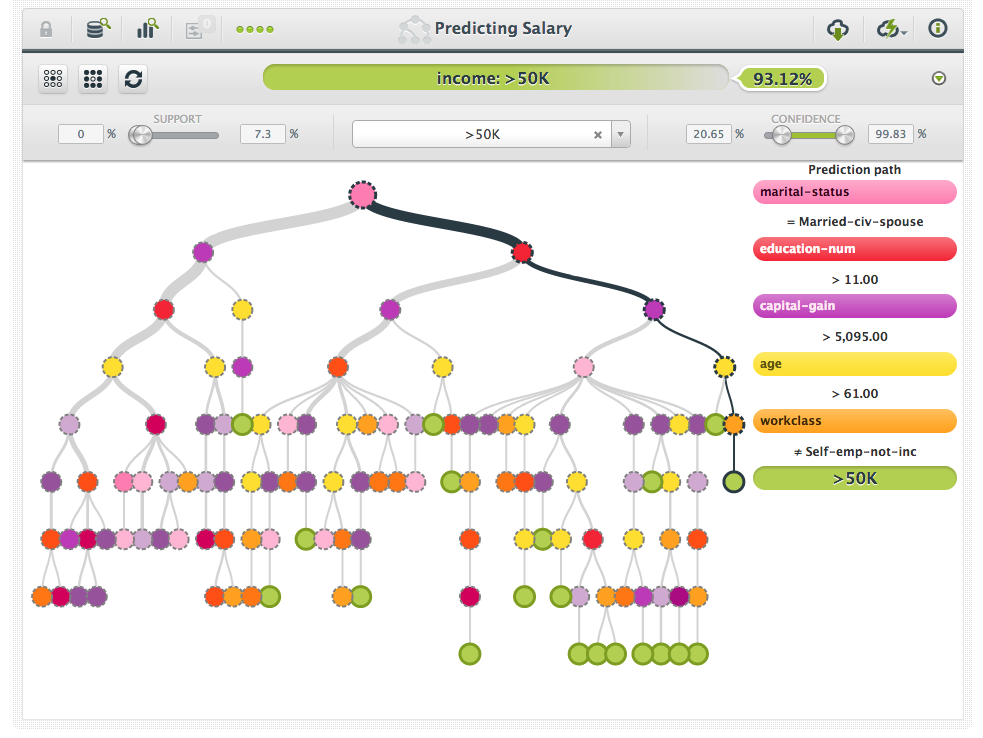
The new controls for support, prediction, and confidence filtering will show up below the original toolbar controls. Each control specifies a filter, and changing the filters will determine which branches are shown in the decision tree. For instance, the tree in the above image is predicting whether or not a given person makes more than $50,000. We can easily change the filter to only show branches that lead to a prediction of over $50,000 by adjusting the corresponding prediction filter (Note: this filter was previously available, we’ve only relocated it with the other new filter controls).
In addition to filtering by the prediction, it is also possible to filter by the support, or percentage of training data that a given branch received. This filter is useful for identifying branches that were well supported by training data, and the following image shows the tree after a minimum support threshold of 1% was applied.

The final way of filtering is by confidence, which is a measure of certainty for the given model on a given branch. Check our recent blog post on this for more information. This filter is useful for identifying branches that consistently contained certain outcomes, which in turn lead to predictions that are very likely given the training data. In the next picture, we see that by adjusting the minimum confidence filter to 95%, that we’ve eliminated all but two of the remaining branches. The currently highlighted branch indicates that individuals that are married, have more than 11 years of education, have capital gains of more than $5,095, and are younger than 61 are very likely to make more than $50,000.

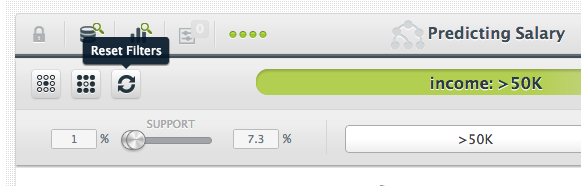
Keep in mind that all of the filters are cumulative. So, each branch must pass each filter in order to be displayed. If you want to reset all of the filters, you can simply press the “Reset Filter” button to return the tree to its original state, as shown in the following picture.
Finding “Interesting” Branches
In addition to the reset filter button, we’ve included two additional buttons that let you quickly set filters for certain interesting branches. The “Rare Interesting Patterns” button will select all branches of the tree that have less than 1% support, while having at least 50% confidence (or be in the lowest decile for expected error in regression trees).

These “rare” branches do not have as much support, but have high confidence. They might be interesting patterns of behavior in your data that are worth exploring. Likewise, the “Frequent Interesting Patterns” button will filter for branches that have support above 1%, with high confidence, as shown in the following image.

Whether you’re only interested in understanding predictions for a certain class, you’re looking for the most confident predictions, or you’re looking for branches that are “off the beaten path”, our new filter interfaces have you covered!
