People like to tweet about stocks, so much so that ticker symbols get their own special dollar sign like $AAPL or $FB. What if you could mine this data for insight into public sentiment about these stocks? Even better, what if you could use this data to predict activity in the stock market? That’s the premise behind PsychSignal, a provider of “real time financial sentiment”. They harvest large streams of data from Twitter and other sources, then compute real time sentiment scores (one “bullish” and one “bearish”) on a scale from 0 to 4. In a blog post titled Can the Bloomberg Terminal be “Toppled”?, a former Managing Director of Bloomberg Ventures asks an intriguing question: Could this kind of crowdsourced data be used to replace some of the functionality of a Bloomberg terminal?
So just for fun, we combined Quandl price and volume data with PsychSignal sentiment scores for 20 technology stocks. We then trained a simple model to predict whether the percentage “swing” (intraday high minus low) is higher or lower than the median, using only data available before the commencement of the trading day. Looking at the SunBurst view, we see a lot of bright green, which means the model is picking up some interesting correlations. For example, if the previous day’s close is down more than 3% from the previous day’s open, the opening price is less than the previous day’s close, and the previous day’s bearish signal is more than 0.84, then the model strongly predicts a price swing higher than the median (shown as a category named “2nd” in the screenshot below).

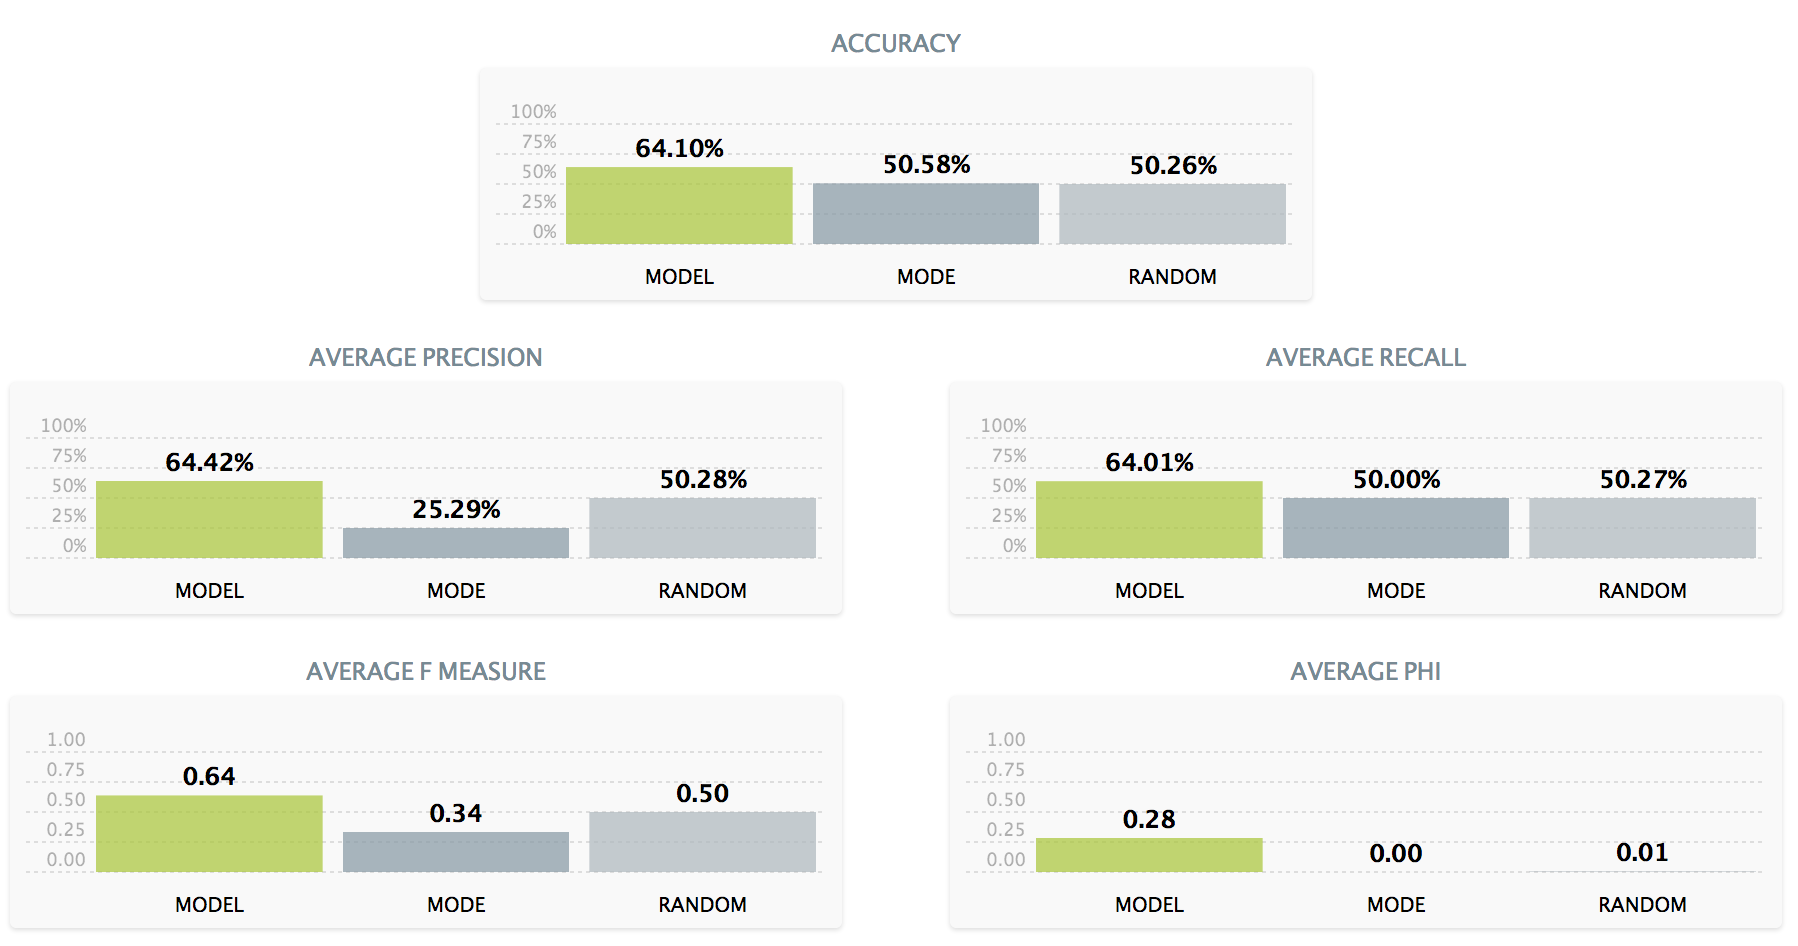
Evaluating the model on a single holdout set shows that it does much better than random guessing (see below). To be extra thorough, I used the BigML API to run 5-fold cross validation (not shown), confirming that average accuracy really is more than 64%.
Interestingly, if I try to predict whether a stock simply went up or down, the model is barely better than flipping a coin; for whatever reason, it’s easier to predict a tech stock’s intraday volatility than its daily gain or loss. Still, the accuracy of the “swing” model is impressive—just look at all that green in the SunBurst view. And you can bet your greek symbols that options traders are interested in predicting volatility.
Company founder James Crane-Baker puts this all in perspective: “Social media is such a rich vein of data about investor sentiment, it would be surprising if it didn’t contain useful information.” And this data is available in real time, so you could try building a model to make predictions using same-day data. Then maybe you’ll really start seeing some green!
