This guest post is authored by Olena Skarlat, Stefanie Pichler, Beatrice Bunjaku, and Pamela Martin, from Vertical Market Solutions at A1 Digital, a BigML Partner.
Machine Learning has proven effective in providing insights into data and processes that drive business decisions in any industry domain. However, the high volume and velocity of data make it challenging to get those insights both proactively, depending on already established processes, and reactively, accounting for the unknown. In this blog post, we give you an overview of the methodology on identifying and addressing the problem of cannibalization of products caused by promotional campaigns in the retail domain. The use case discussed here aims to analyze the impact of promotional products, specifically to identify cannibalization effects, i.e., when the promotions decrease sales of the non-promotional products dramatically.
An example: A chain of supermarkets decides to have a promotion on 500 grams of chicken breasts. This promotion has significant effects on the sales figures for certain other products. In our example, the sales of beef steaks and various turkey products dropped by more than 20% within the period of the promotion. However, many of those associations are not discovered upfront. If the retail management could tackle such an influence in advance of the promotion of other products, they could adjust their demand planning to order products that will be in demand and order fewer products that will be less popular during the promotional period.
Therefore, in this use case, we predict the demand for products accounting for promotional campaigns and as a result, stocks can be adjusted, and waste is reduced. We have implemented this use case as a fully automated Machine Learning application that is capable of (i) learning Machine Learning models on data, (ii) providing valuable insights, and (iii) performing monitoring and assessing Machine Learning model competence over time.
The input data for this use case is from a retailer that has multiple supermarkets in different regions. It contains sales transactions for meat products over several years. Data also includes information on whether the product was on promotion over a certain period. The outputs of this use case can be used by two different roles: (i) a demand planner (operational outputs) and (ii) a business analyst (Machine Learning analytics). The operational output contains insights about the negative impacts of promotional products on other products. The purpose of getting such insights is to adjust the stock in supermarkets accordingly and not to order, for instance, foods that spoil fast if it is expected that their sales will be decreasing. The Machine Learning analytics output contains Machine Learning models, performance parameters, and evaluation results over time. These insights provide the opportunity to assess the performance of Machine Learning models over time by using new incoming daily sales transaction data while intermittently retraining those models when their performance takes a dive.
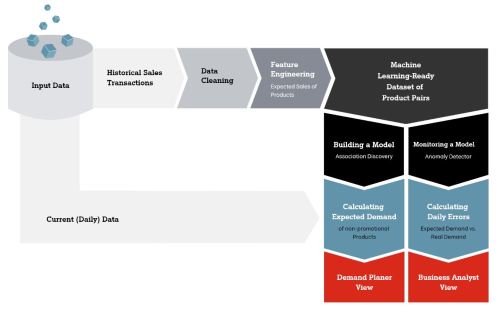
The methodology includes building Machine Learning models to get novel promotional cannibalization insights and creating workflows to enable the Machine Learning model life cycle, monitoring, and evaluation. The vital part of this use case is the A1 Digital Machine Learning Platform powered by BigML. The platform fully automates the time-consuming work of hand-tuning Machine Learning models and executing complex custom workflows they are part of. Figures 1 and 2 accordingly show the life cycle of this use case along with the main machine learning workflow. Other automated workflows deal with data transformation, receiving predictions, and performing daily evaluations of models.

Machine Learning models in this use case include regressions, association discovery, and anomaly detectors. Regression models are used to predict expected sales for products to analyze and estimate if the actual sales of non-promotional products are decreasing or increasing because of promotional campaigns. Association discovery finds ‘significant’ associations, or so-called association rules, between promotional and non-promotional products. We are interested in identifying the negative impact of promotions, i.e., instances where the expected sales of products are decreased by more than 20%. For example, Figure 3 shows the associations generated for the pairs of products with a considerable sales decline compared to the expected sales. A promotional product with the identifier id=141 is affected by the non-promotional product with the id=89, non-promotional products with id=44, and id=62 are affected by the promotional product id=196 and so on.

The results of the association discovery are converted into sales decrease percentages, i.e., showing how sales for certain products will be slipping depending on promotional products during the promotion period. These results can be used to proactively analyze promotions during their planning phase and to adjust the impacted retail SKUs ahead of time. This is especially important when the products spoil fast, i.e., food items and drinks. For example, as it is shown in Figure 4, the promotional product PRODUCT-45 is expected to negatively affect sales of products PRODUCT-98, PRODUCT-53, PRODUCT-144, and so on. This means that it will be efficient to stock less of those non-promotional products during the promotional period of the PRODUCT-45 to save money and reduce any possible waste.

Once the association discovery model is created, it’s a good idea to monitor how well those association rules perform on a daily basis to constantly learn from the new incoming sales transaction data. Therefore, we also train anomaly detectors, which is a powerful tool to measure the reliability of association rules. We build an anomaly detector every time the association rules are produced. Having quantified how anomalous the new daily sales transaction data distribution is, we can get a sense of how different the new data is from the data that was used to produce the original association rules (see Figure 5). This approach tells Machine Learning analysts when to retrain the association rules. Having a high anomaly score for a certain period means that the association rules do not particularly apply to the new sales transactions perhaps due to changes in customer behavior or a major event such as the Coronavirus outbreak causing dramatic societal shifts. When the association rules are updated, it is once again advisable to allow for a testing period to evaluate if the new rules perform better on the new incoming sales transaction data.

This use case is a good example of how Machine Learning can provide an objective overview of how various promotional campaigns affect sales of the non-promotional products in the retail domain. Machine Learning comes to the rescue to identify and tackle the negative effects of promotional campaigns on other products to more proactively adjust their stock, reduce waste, and most importantly protect the retailer’s margin.
Let us know if you have a similar problem and stay tuned for more case studies in the near future!

Well Done and great efforts