This is the third post of our Linear Regression series. BigML is bringing Linear Regression to the Dashboard so that you can solve regression problems with the help of powerful visualizations to inspect and analyze your results. Linear Regression is not only one of the best-known but also one of the best-understood supervised learning algorithms. It has its roots in statistics but gets utilized in machine learning quite a bit as well.
In this post we would like to walk you through the common steps to get started with Linear Regression:
1. Uploading your Data
As usual, start by uploading your data to your BigML account. BigML offers several ways to do it, you can drag and drop a local file, connect BigML to your cloud repository (e.g., S3 buckets) or copy and paste a URL. BigML automatically identifies the field types. Field types and other source parameters can alternatively be configured by clicking in the source configuration option.
2. Create a Dataset
From your source view, use the 1-click dataset option to create a dataset, a structured version of your data ready to be used by a Machine Learning algorithm.
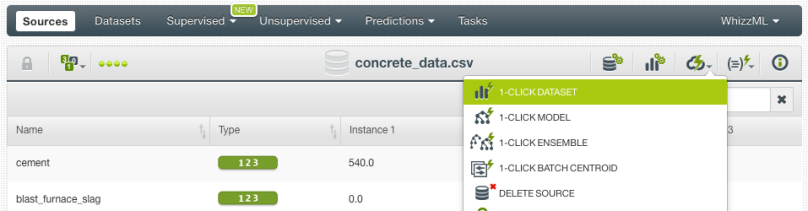
In the dataset view, you will be able to see a summary of your field values, univariate statistics, and the field histograms to analyze your data distributions. This view is really useful to see any errors or irregularities in your data. You can also filter the dataset by several criteria and create new fields using different pre-defined operations as needed.

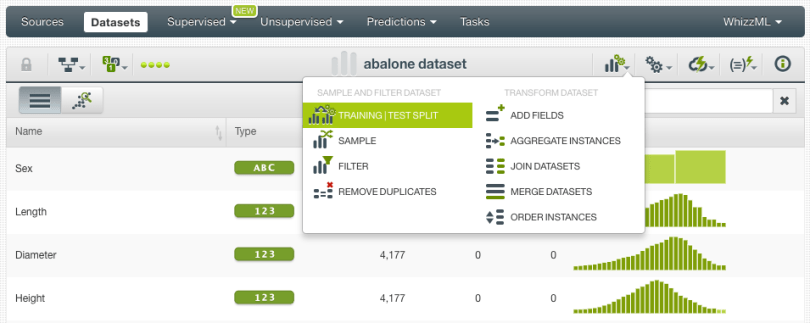
Once your data is clean and free of errors you can split your dataset into two different subsets: one for training your model, and the other for testing. It is crucial to train and evaluate your model with different data to ensure it generalizes well against unseen data. You can easily split your dataset using the BigML 1-click option, which randomly sets aside 80% of the instances for training and 20% for testing.
3. Create a Linear Regression
Now you are ready to create the Linear Regression using your training dataset. You can use the 1-click Linear Regression option, which will create the model using the default parameter values. However, if you are a more advanced user and you feel comfortable tuning the Linear Regression parameters, you can do so by using the configure Linear Regression option.


The list below gives a brief summary of each of the configuration parameters. If you want to learn more about them please check the Linear Regression documentation.
- Objective field: select the field you want to predict. By default, BigML will take the last valid field in your dataset. Remember it must be numeric!
- Default numeric value: if your numeric fields contain missing values, you can easily replace them with the field mean, median, maximum, minimum or zero using this option. It is inactive by default.
- Weight field: set instance weights using the values of the given field. The value in the weight field specifies the number of times that row should be replicated when including it in the model’s training set.
- Bias: include or exclude the intercept in the Linear Regression formula. Including it yields better results in most cases. It is active by default.
- Field codings: select the encoding option that works best for your categorical fields. BigML will automatically transform your categorical values into 0 -1 variables to support non-numeric fields as inputs, which is a method known as dummy encoding. Alternatively, you can choose from two other types of codings: contrast coding or other coding. You can find a detailed explanation of each one in the documentation.
- Sampling options: if you have a very large dataset, you may not need all the instances to create the model. BigML allows you to easily sample your dataset at the model creation time.
In terms of performance, the focus for Linear Regression is whether to include or exclude the bias term. All other parameters also depend on the data, the domain and the use case you are trying to solve. It’s natural that you want to understand the strengths and weaknesses of your model and iterate trying different features and configurations. To do this, the model visualizations explained in the next point would be very helpful.
4. Analyze your Results
When your Linear Regression has been created you can use BigML’s insightful visualizations to dive into the model results and see the impact of your features on model predictions.
BigML provides a 1D chart, a partial dependence plot (PDP) and a coefficient table to analyze your results.
1D Chart and PDP
Both 1D chart and PDP provide visual ways to analyze the impact of one or more fields on predictions.
For the 1D chart, you can select one numeric input field in the x-axis. In the prediction legend to the right, you will see the objective field predictions as you mouse over the chart area. The chart can also show the 95% prediction interval band in blue. This means, for any given point on the x-axis, its y value will be within this blue range with 95% probability. You can choose to show or hide the interval band.

For the PDP, you can select two input fields, either numeric or categorical, one per axis and the objective field predictions will be plotted in the color heat map chart.
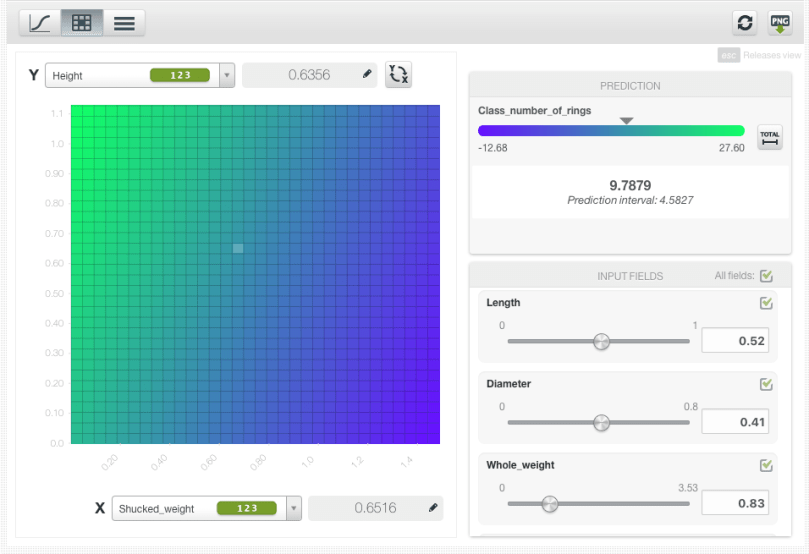
By setting the values for the rest of the input fields using the form below the prediction legend, you will be able to inspect the combined interaction of multiple fields on predictions.
Coefficients table
BigML also provides a table to display the coefficients learned by the Linear Regression. A positive coefficient indicates a positive correlation between the input field and the objective field, while a negative coefficient indicates a negative relationship.

5. Evaluate the Linear Regression
Like any supervised learning method, Linear Regression needs to be evaluated. Just click on the evaluate option in the 1-click menu and BigML will automatically select the remaining 20% of the dataset that you set aside for testing.

The resulting performance metrics to be analyzed are the same ones as for any other regression models predicting a continuous value.
You will get three regression measures in the green boxed histograms: Mean Absolute Error, Mean Squared Error and R Squared. By default, BigML also provides the measures of two other types of models to compare against your model performance. One of them uses the mean as its prediction and the other predicts a random value in the range of the objective field. At the very least, you would expect your model to outperform these weaker benchmarks. You can choose to hide either or both of the benchmarks.

For a full description of the regression measures see the corresponding documentation.
6. Make Predictions
In BigML, you can make predictions for a new single instance or multiple instances in batches.
Single predictions
Click in the Predict option and set the values for your input fields.
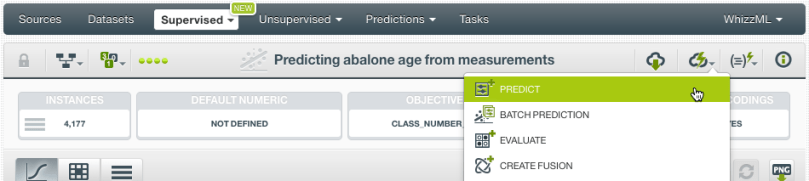
A form containing all your input fields will be displayed and you will be able to set the values for a new instance. At the top of the view, you will see the objective field prediction changing as you change your input field values.

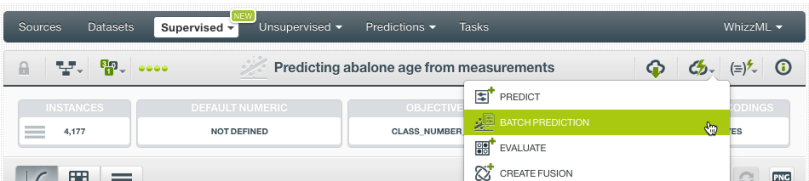
Batch predictions
Use the Batch Prediction option in the 1-click menu and select the dataset containing the instances for which you want to know the objective field value.
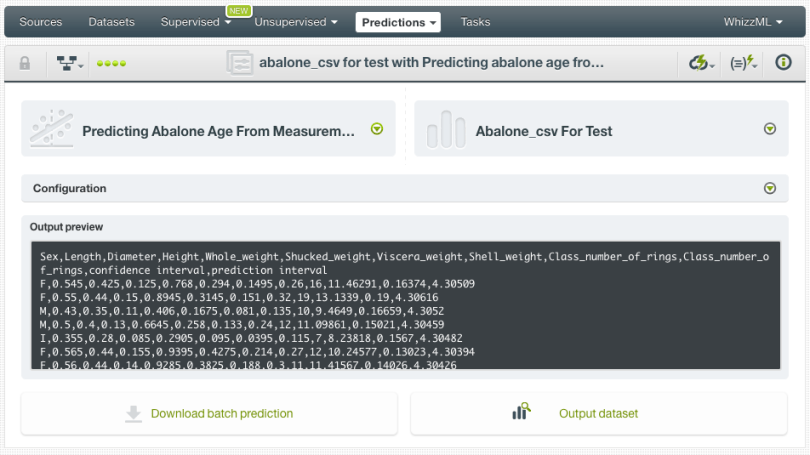
You can configure several parameters of your batch prediction such as the option to include both confidence interval and prediction interval in the batch prediction output dataset and file. When your batch prediction finishes you will be able to download the CSV file and see the output dataset.
If you want to learn more about Linear Regression please visit our release page for documentation on how to use Linear Regression with the BigML Dashboard and the BigML API.

2 comments