This blog post, the second in a series of 6 posts exploring OptiML, the new feature for automatic model optimization on BigML, focuses on a real-world use case within the healthcare industry: medical appointment “no shows”. We will demonstrate how OptiML uses Bayesian parameter optimization to search for the the best performing model for your data. The status of the search is continually updated in the BigML Dashboard and the process yields a list of models ranked by performance, which enables further exploration, evaluation, and prediction tasks.
The Dataset
With regards to healthcare expenses, “no show” appointments represent a major expense, estimated to cost hospitals over $150 billion per year. A “no show” is when all the necessary information for a medical appointment has been delivered, yet the patient fails to arrive at the scheduled appointment. This is distinct from events like cancellations, which require intervention and rescheduling, but yield nowhere near the same amount of financial burden.
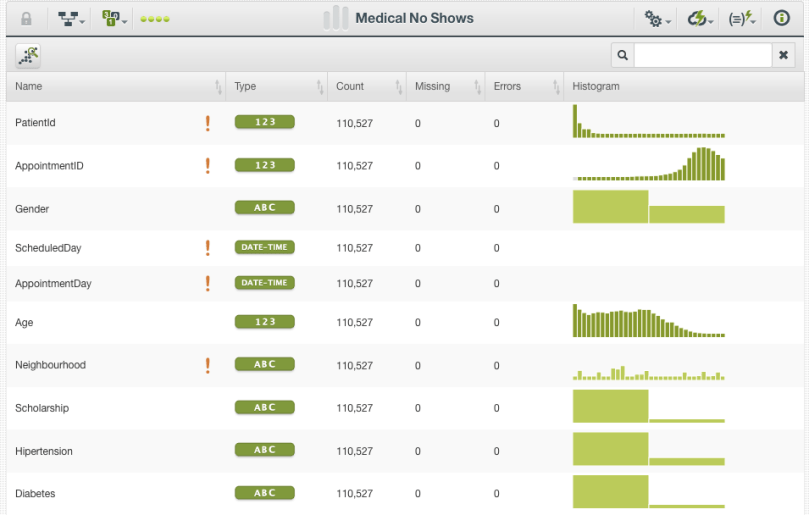
Here we are using a verified dataset from Kaggle, which has documented over 100,000 examples of scheduled medical appointments, each consisting of 15 variables (fields). In this dataset, 22,319 instances, or ~20% of the total, are labeled as “no shows”. The fields describing each instance consist of simple descriptive information about the patient (e.g., age, gender), health characteristics (e.g., hypertension, diabetes), geographical information (e.g., neighborhood), communication information (e.g. SMS text), scheduling, and appointment date and time information.
Automatic Model Optimization
The OptiML configuration options, by design, consist of relatively few options. Selecting the objective field from the dataset is essential; in our use case, this is whether or not a patient is a “no show” for their visit. The other main parameters control how extensively the OptiML search will run by setting the maximum training time and the number of evaluations. The advanced configurations allow you to choose which types of Machine Learning algorithms will be evaluated among models (decision trees), ensembles, logistic regression, and deepnets, the evaluation approach (default being cross-validation), and the desired optimization metrics.

After choosing OptiML from the supervised drop-down menu, training the model is as simple as one-click! To monitor the progress of the models that are being trained and evaluated, the Dashboard will display the elapsed time, a running series of F-measures indicating evaluations, and a counter for the number of resources created.

Once the OptiML process is complete, a summary view displays the total number of resources and models created and selected, along with the total elapsed time and amount of data processed. The selected models are the best-performing ones, according to the evaluation metric originally chosen for the analysis. Because many of the evaluations are part of a cross-validation process, it is expected for the number of selected models to be substantially lower than the total number of models evaluated.
Assessing Classification Model Performance
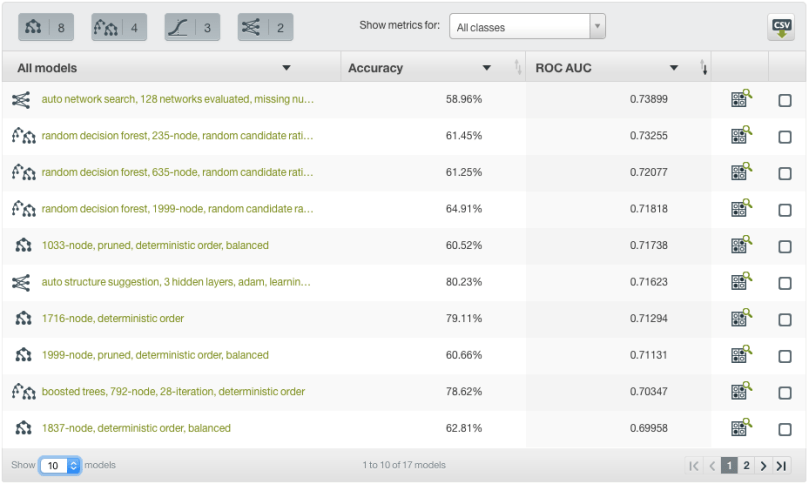
In our example, we can sort our best performing models by any performance metric we would like. We can also view two metrics simultaneously, such as precision and recall, if we would like to consider different applications or error tolerances. Here we are sorting by ROC AUC, and also viewing the corresponding accuracy for each of the selected models. We can see that our top performing model is a deepnet using an auto network search, which has a ROC AUC of 0.73899 and accuracy of 58.96%.
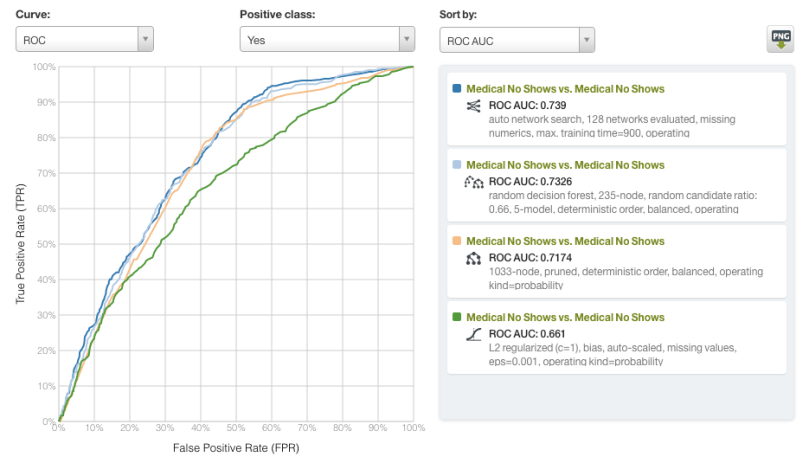
The Dashboard also allows us to select individual models generated by OptiML and compare their evaluations. Here we display the ROC curves for the top performing deepnet, ensemble, model (decision tree), and logistic regression. With regards to AUC, only the logistic regression model (in green, AUC = 0.661) noticeably underperforms relative to the alternatives.
The root cause behind the estimated 54.3 million patients that skip scheduled medical care is widely thought to be a combination of financial hardship, anxiety about long wait times, transportation difficulty, and poor medical literacy. With our current dataset, however, it is difficult to engineer features that can accurately represent all of these issues. This is a good reminder that model optimization alone will not guarantee a result with top-notch performance. Like all Machine Learning methods, OptiML’s performance will only be as good as the data it’s fed. Regardless, OptiML allows us to quickly prototype and assess maximal performance with minimal effort, allowing for more resources to be dedicated to high-yield tasks such as additional data acquisition and feature engineering.
Want to know more about OptiML?
If you have any questions or you would like to learn more about how OptiML works, please visit the release page. It includes a series of blog posts, the BigML Dashboard and API documentation, the webinar slideshow as well as the full webinar recording.

Hello, I would like to re-post this post on my blog. How can i do it? thanks!