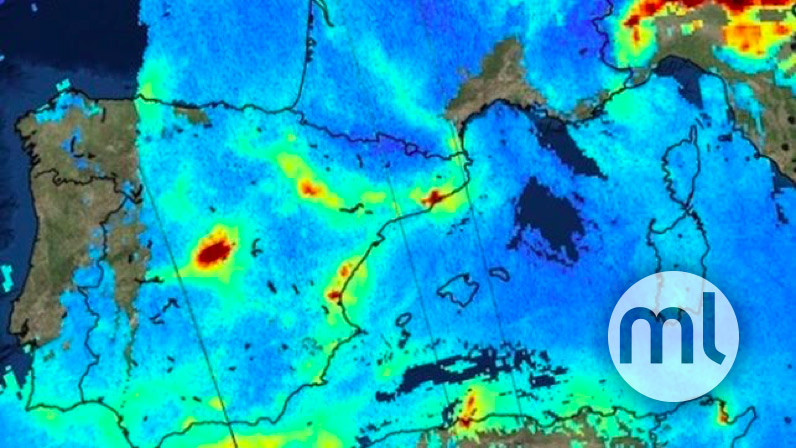
Air pollution is a tremendous problem in big cities, where health issues and traffic restrictions are continuously increasing. The concentration of Nitrogen Dioxide (NO2) is commonly used to determine the level of pollution. In Madrid, Spain, there are several stations in different parts of the city that are constantly collecting the NO2 levels. My colleague, Jaime Boscá, and I applied BigML to see if we could accurately predict air pollution in Madrid.
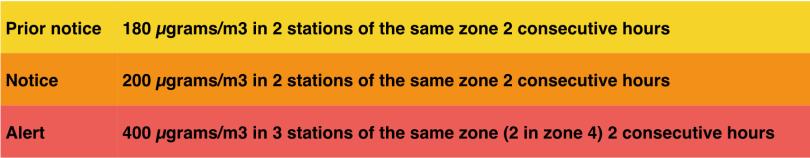
A set of alerts based on the NO2 levels (shown in the table below) have been defined to monitor and avoid high pollution levels.
These alerts trigger some measures that subsequently enforce traffic restrictions for Madrid citizens. The main problem is that these levels of NO2 are usually reached at the end of the day and the traffic restriction measures take effect the next day. Therefore, the population affected has only a few hours to rearrange their means of transport the following day. These measures have caused many criticisms of the local government. Predicting such alerts would help warn the population in advance so they have more time to reschedule their transportation plans.
Is it possible to predict which days will have pollution alerts?
Our goal is to predict a pollution alert (YES/NO) in advance by 1, 4, and 7 days. A pollution alert means that one of the previous alert levels has been reached.
Data collection
To address Madrid’s air pollution problem, we used three main data sources about the city:
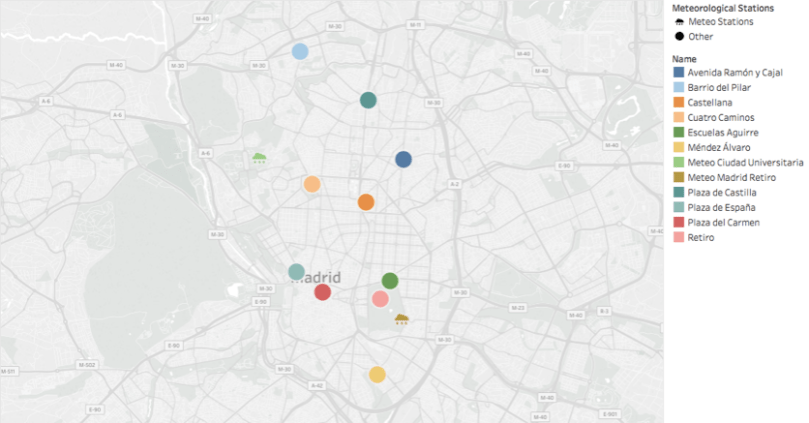
- Air quality data: has been gathered for years and is available for multiple air measuring stations gathering NO2 levels on an hourly basis.
- Weather data: information available daily about temperature, rain, and wind.
- Historical traffic data: detailed traffic load information available online for main streets and highways around Madrid.
The data used was collected from 2013 to 2017. To simplify the problem, we limited the analysis to zone 1 (shown below) as it includes most of the Madrid city area, which has the greatest number of air stations.
Data transformations
Both the weather information and the pollution alerts statuses are available daily. That’s why data has been represented with daily granularity: each sample (or instance) will provide information for a given day. Therefore, aggregated information of weather and air are included as additional features per day.
We also considered traffic conditions and the predictions of traffic in our model. In order to include traffic predictions, we used another model to predict Madrid traffic, which was implemented in BigML using features such as weekdays and holidays. The evaluation results have been promising, allowing us to use BigML traffic batch prediction results as features in our model for predicting air pollution. In the same way, temperature predictions were also modeled and used as features.
Predicting air pollution is a challenge. How many days in advance could we anticipate obtaining an acceptable prediction? We tried three different predictions: 1, 4 and 7 days in advance. Each prediction uses a different time window for the same features.
Feature engineering
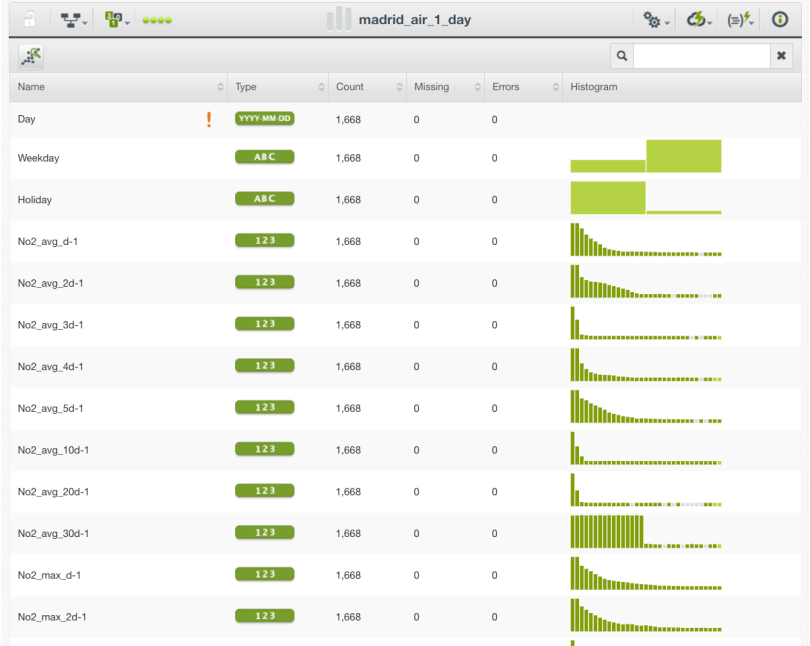
Most datasets can be enriched with extra features derived from existing data. In our case, we can use time-based information such as feature values for a previous date or number of days since an event happened. We used the following features:
- NO2 averages and maximum values.
- Maximum, minimum and average temperatures.
- Rain, wind and traffic information.
- Traffic predictions.
- Number of days since the last alert.
The datasets used including all features are available on the BigML Gallery:
Data exploration
The colored table previously mentioned shows the 3 air pollution alert levels defined in Madrid: “prior notice”, “notice” and “alert”. Within the five years of available data, only “prior notice” and “notice” alerts occurred; red “alert” never happened. Also, the distribution of pollution alerts is not balanced, but luckily, not many alerts are raised: less than 100 “notice” and “prior notice” states have been observed in total.
That’s why we decided to group alerts and create a boolean objective field to predict whether or not a pollution alert will be raised.
From our analysis, we can see that NO2 levels are directly related to air pollution (shown in the visualization below). We can also see that significant rain and wind have an impact on NO2 levels.
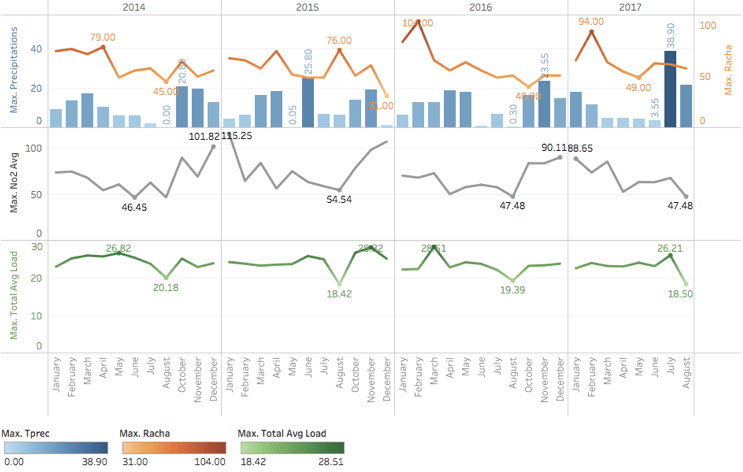
In the graph above, maximum total precipitation daily is represented in blue and wind maximum gust speed is in orange. Traffic load is represented in green while NO2 average level is represented in grey. In general, high wind speeds and abundant precipitations seem to correlate with lower NO2 levels, while low traffic loads seem to correlate with lower NO2 levels.
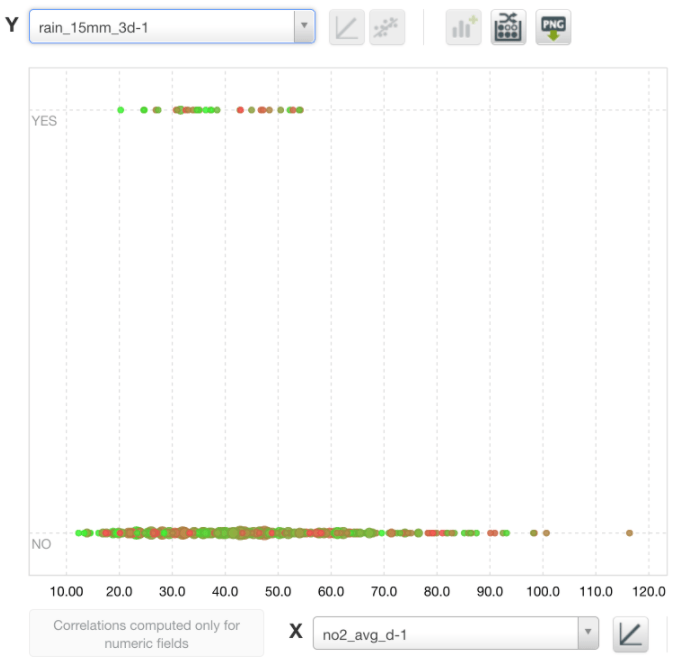
The BigML scatter plot graphs below support this correlation. The following graph displays the correlation between the boolean of whether there was rain over 15mm during the last 3 days and the average level of NO2. We can observe that all cases with rain over 15mm correspond to NO2 levels under 55 µgrams/m3.
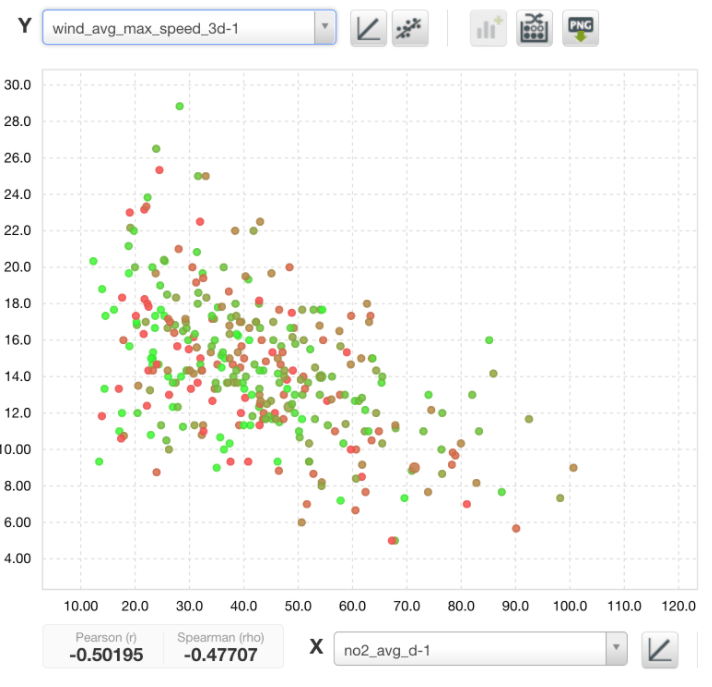
The next graph displays the correlation between the wind daily average maximum speed over the past 3 days and the NO2 level. When the wind average maximum speed is over 20km/h then NO2 is under 50 µgrams/m3.
Modeling
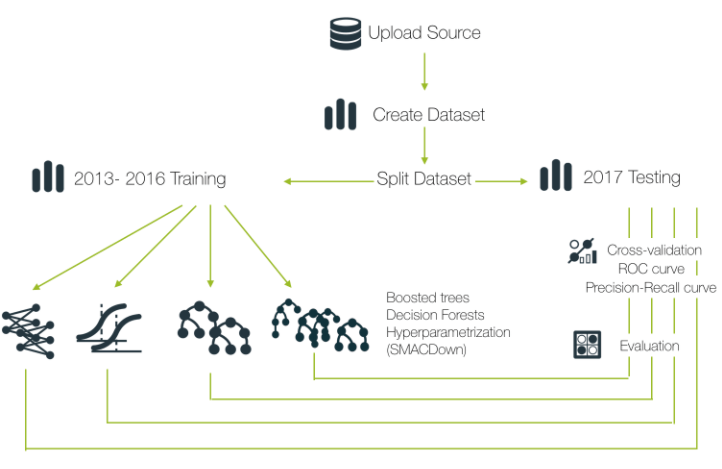
Predictive modeling involves evaluating models and comparing results to select the appropriate algorithms and their specific parameters. Initially, we tried different algorithms available in BigML suitable for classification (models, logistic regression, ensembles, and deepnets). Ensembles gave the best results (see all models comparison in the next evaluation section). Using the WhizzML script SMACdown we could automatically test all possible parameter settings for ensembles.
Evaluating
Initially, the dataset is split chronologically: data from 2013 to 2016 is used for training and 2017 data is used as a test set for evaluations. Evaluations criteria are based on the Area Under the Curve (AUC) of the ROC curve (graphically representing the trade-off between the recall and specificity for classification problems). Since we have a very imbalanced dataset (the days with alerts are very few compared to the days without alerts), we need to balance the model by applying a probability threshold. The optimal threshold has been set trying to minimize the False Negatives (days predicted as not having alerts but they actually have an alert) without penalizing too many of the False Positives (days predicted as having alerts, but they don’t actually have an alert). We have compared all the available models using the BigML comparison tool to ensure we selected the best performing model.
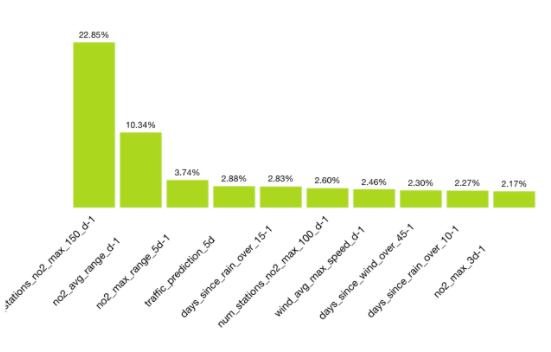
Below we can find the field importance graphic for this ensemble used in the evaluation. The most important field is the number of stations having a NO2 measure over 150 µgrams/m3 the day before, followed by the NO2 average range the day before, and the NO2 maximum range over the 5 previous days. Traffic prediction, rainfall, and wind representative fields also appear in the top 10.
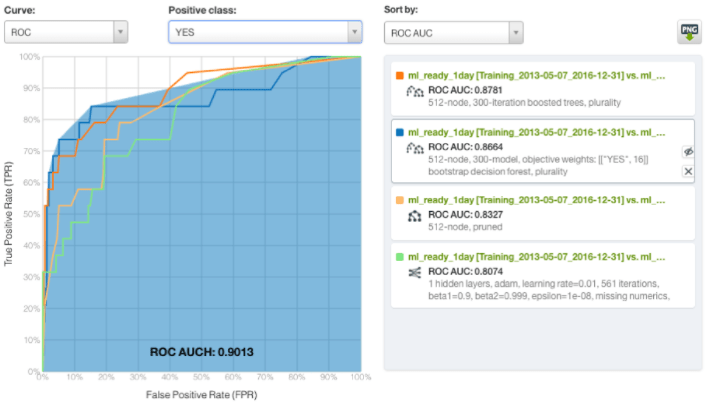
We can see in the figure below the different evaluations for predictions 1 day in advance. The boosted ensemble of 300 iterations (represented in orange below) gave the highest ROC AUC (0.8781).
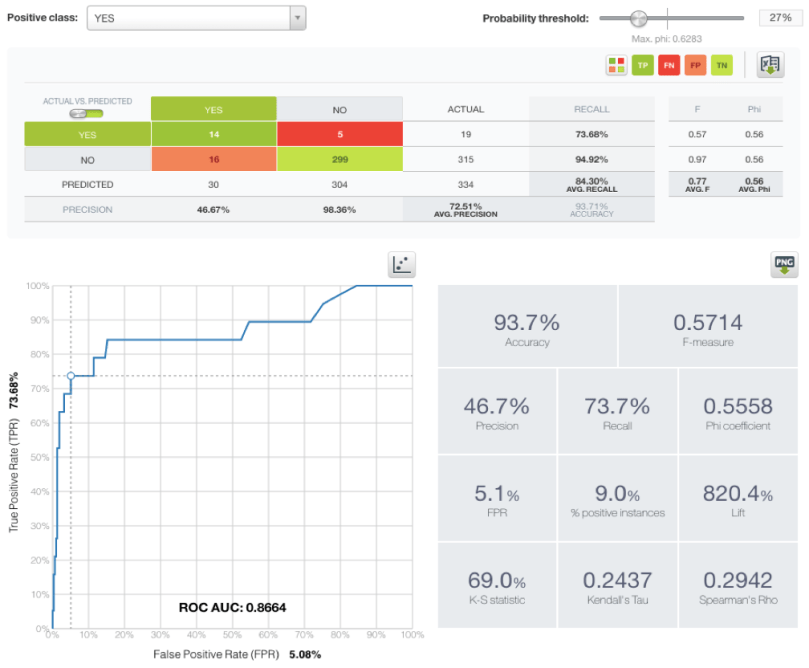
Once we have selected the best model by looking at the AUC metric, we need to look at the recall and precision of a given model to select the optimal threshold to start making predictions. The recall is the number of true positives over the number of positive instances, while the precision is the number of true positives over the number of positive predictions. The image below displays a BigML prediction evaluation for 1 day with the suitable probability threshold set to 27%. We can see how the model predicted 14 out of 19 actual alerts resulting in a 73.68% recall. It also predicted 16 other days that did not have an alert incorrectly which means a precision of 46.67%.
The chart below shows the recall and precision for the three predictions performed: 1, 4, and 7 days in advance.
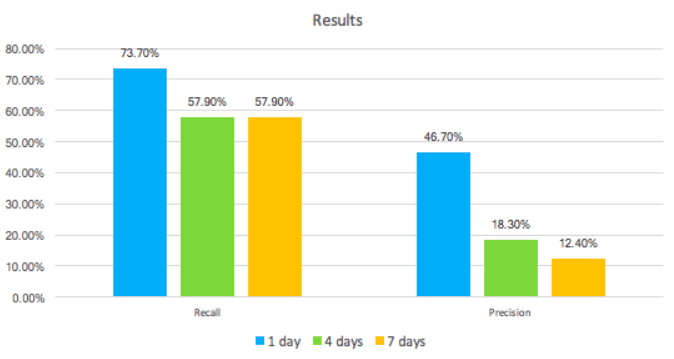
As expected, the higher number of days in advance we try to predict the lower the performance. Nevertheless, making pollution alert predictions even one day in advance would already benefit citizens in their daily lives, as they are currently being warned only a few hours in advance.
Taking this use case a step further, predicting pollution levels accurately and sufficiently in advance could even enable us to reduce high pollution levels, one city after another. Insights from Machine Learning aren’t meant to simply remain as additional information about our world – they are meant to be put to good use and improve people’s lives, in our businesses, societies, and beyond.

Hello from Pulse Lab Jakarta. Noticed some similarities while reading through your blog with our attempt to nowcast air quality in Indonesia — in our case using photos shared on social media. Sharing a link on the research here, in case you’re interested: https://medium.com/pulse-lab-jakarta/nowcasting-air-quality-using-social-media-f478460784f5