(NOTE: We suggest that you also read our follow up post including the post-mortem analysis of the results from the machine learning model described here.)
This Saturday Americans will witness the 147th Belmont Stakes, thoroughbred racing’s 3rd and final leg of the highly coveted Triple Crown. If you follow horse racing, you will know that no horse since Affirmed in 1978 has been able to claim this elusive prize. In fact, Affimed was only the 11th Triple Crown winner in the long history of American thoroughbred racing. Since 1978 there have been 13 close calls, where a horse won both the Kentucky derby and the Preakness Stakes yet failed to repeat the same success in Belmont Park (in Elmont, NY), where the famed Secretariat showcased a historic performance in 1973 and broke the world record for the distance — a record that still stands today.
As was the case during last year’s Triple Crown (one featuring a rare California-bred colt aptly named California Chrome), 2015 has also presented lovers of the “Sport of Kings” with what seems as a worthy suitor in American Pharaoh. American Phaorah won the prestigious Kentucky Derby by a length in a hard-fought battle ahead of Firing Line. He then carried his form to the Pimlico Race Track to also claim the Preakness Stakes on a rain drenched track pretty much wire-to-wire ahead of serious competition — this time by a comfortable 7 lengths. This has stoked the sports media machine and here we are again eagerly awaiting to crown a new super horse after some 37 years.
But the question remains, can American Pharaoh really achieve the feat? If you ask FiveThirtyEight’s Benjamin Morris or Wired Magazine , it remains a tall order for this year’s contender to buck the recent trend and to master the “Test of Champions” on Saturday. Many experts tie these near misses to several factors including:
- the longer race distance of Belmont Stakes (12 furlongs = 1.5 miles = 2400 m.) as compared to the Derby (10 furlongs = 1.25 miles = 2000 m) and Preakness (9.5 furlongs = 1.19 miles = 1900 m), which demands more of a distance horse that contrasts against the more sprint-like first two legs of the Triple Crown
- the grind of having to run three stakes races in five weeks – often against a Belmont field that hasn’t gone through the same gauntlet and thus is more fresh.
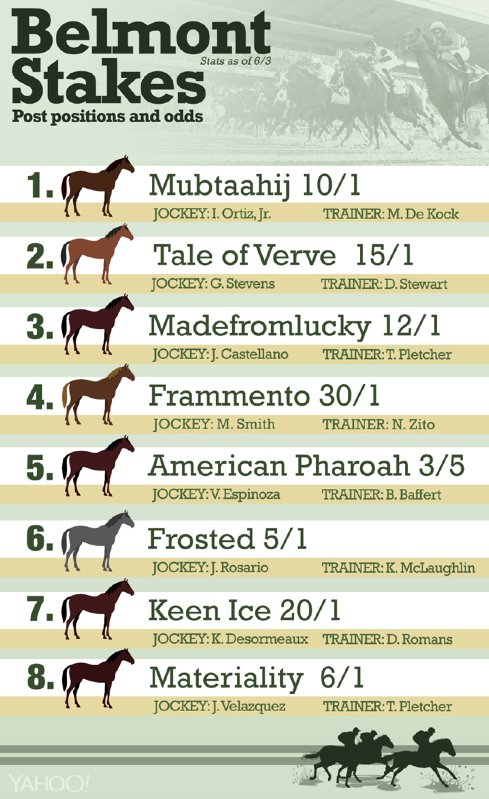
Despite these factors, its seems odds-makers are still putting a lot of high hopes on Triple Crown contenders frequently listing them as even money bets. American Pharaoh is no exception at 3/5 morning line odds with odds for the nearest horse (Frosted) listed as 5/1 — more than 8 times the payoff.
Though we have taken note, we were not fully satisfied with the oft-repeated assumptions and subjective opinions with no grounding in data. Therefore, we thought it may be a fun exercise to construct a predictive model using BigML in order to predict the outcome of this weekend’s race among the 8 entrants. As we go into the details of what we found out, please be forewarned that we are NOT professional handicappers here. While we hope you enjoy the informational aspect of this post, we urge you NOT to bet your life savings on any of the predictions below. (If you are not particularly interested in how this analysis was conducted, you may prefer to jump to the conclusion section or else read on!)
THE HANDICAPPING DATA
Thoroughbred racing records are pretty well kept and go back a long time. However the format has evolved over time and because of its non-digital origins, online services that offer such data in a reliable way are somewhat limited. For this analysis, we used publicly available race result sheets for all Triple Crown races (Kentucky Derby, Preakness Stakes, Belmont Stakes) in the last 25 years.
So, what data do we have after all? Below are the horse and race related variables we used to build a predictive model:
- RACE YEAR
- RACE NAME
- HORSE NAME
- HORSE PEDIGREE
- JOCKEY
- TRAINER
- FINISH RANK
- FINISH TIME
- TRACK CONDITION (i.e. Fast, Good, Sloppy)
- SCRATCHED?
- 1st SPLIT (The time of the leading horse after 2 furlongs or 400m.)
- 2nd SPLIT (The time of the leading horse after 4 furlongs or 800m.)
- 3rd SPLIT (The time of the leading horse after 6 furlongs or 1200m.)
- 4th SPLIT (The time of the leading horse after 8 furlongs or 1600m.)
- ODDS (Morning line odds for each horse to run the Belmont Stakes)
- LENGTHS BEHIND (# of horse lengths this horse was behind as compared to the race winner.)
- % of RACE RECORD TIME
- AVERAGE SPEED
- POINTS (Proprietary measure of the horse’s race performance as compared to the best ever recorded time for that distance and track.)
Horse race handicapping is pretty much a science these days and there are a number of businesses setup on this premise. Admittedly, there are many more pieces of data available that we chose to leave out due to time constraints. One could argue that a number of those could potentially factor in influencing the race predictions e.g. Equipment, Post Position, Sire etc. However, the list above does capture a good level of detail on the previous Triple Crown performances by these elite horses. As such, these variables should intuitively be linked to the results we have observed over the last 25 years.
All in all, we looked at 729 distinct horses having raced in at least one of the 74 Triple Crown races and filtered it down to our final dataset containing 256 horses having participated in the Belmont Stakes since 1991.
MODELING & RESULTS
BigML’s decision trees can unearth instant insights that are hidden in your data by analyzing numerous input variables as they relate to your target variable. In this case, we are trying to predict LENGTHS BEHIND for Belmont Stakes 2015. So that becomes our “Target Variable”. The input or independent variables are all the others listed above — inclusive of the 2015 Kentucky Derby and Preakness Stakes that took place in the last 5 weeks. Once the data munging process is over (in this case we used pandas), we uploaded our “Machine Learning ready” data file (i.e., data was in tabular format) to BigML and started analyzing it using BigML’s built-in Anomaly Detector, Clustering and Decision Tree algorithms. To be able to compare and contrast different model configurations, we performed several iterations of the model building process — evaluating model performance at the end of each iteration and either keeping or dumping the original model based on the results. In most cases, the whole process took less than a minute or two, and just like that we had our models correlating 25 years worth of racing data to this Saturday’s expected outcomes. We finally settled on a Decision Tree ensemble model (with Bagging) containing 250 decision trees within it. This particular model handily beat the random picks benchmark, and was able to also comfortably beat (by over 12%) a more educated benchmark utilizing the historic average lengths back figure for Belmont Stakes. All of this benchmarking was done without a line of coding, instead relying on BigML’s powerful model evaluation feature.

The nifty Model Summary Report feature of our decision tree has revealed the following as the most influential input variables on predicting Belmont Stakes performance with the predictive power expressed as %s listed in parentheses after each:
- ODDS — BELMONT (22%)
- JOCKEY (22%)
- TRAINER (13%)
- HORSE PEDIGREE RELATED (10%)
- RACE YEAR (4%)
- LENGTHS BEHIND — KENTUCKY DERBY (4%)
- HORSE PEDIGREE RELATED (4%)
- AVERAGE SPEED — KENTUCKY DERBY (3%)
- POINTS — KENTUCKY DERBY (3%)
- % of RACE RECORD TIME — PREAKNESS (3)
ANALYSIS & CONCLUSION
Let’s start by stating that the interpretation here is not written in stone, but rather based on a general understanding and the recent trends in the sport of American thoroughbred racing. Furthermore, none of this is meant to entice you, the reader, into gambling on this weekend’s race. And none of if should be treated as professional handicapping advice by any measure.
With that said, it is somewhat expected and relieving that the betting odds are the foremost predictor for this weekend’s race. If it did not show up at all, we’d be both surprised and worried about the racing fans relying on the experts’ and fellow racing fans’ “collective intelligence”. However, the model tells us that the odds are not all that they are cracked up to be (at least for the Belmont Stakes). After all, the odds explain far less than half the variation in results and thus cannot be exclusively trusted in this case.
Next up are the Jockey and Trainer of the horse. These point out to certain experienced teams having an edge in Belmont either because they are based there or they have a history of success and/or a higher ability to attract great horses. In a way, this reminds us of the recruitment halo effect programs and coaches like John Calipari of University of Kentucky NCAA basketball fame have come to accomplish in other competitive arenas. In other words, success begets more success.
There is also a large chunk of the handicapping world that puts a lot of emphasis on a horse’s pedigree. There are very detailed accounts of the progeny going back 9 or 10 generations deep just to be able to tell if a given horse carries the genes to run longer distances or whether it is better suited for sprint racing. Similarly, experts claim that these signals can determine how well the thoroughbred will perform on turf vs. dirt surfaces. It is a bit of an art mixed in with some science, so we won’t go into details here. Although these factors did not weigh in as heavily as we expected, they do have a say in the predictions, which hopefully somewhat justifies the crazy high stud fees some thoroughbreds are able to secure for their breeders.
At first, it was surprising to us that the Race Year also mattered. We suspect this may have something to do with the aforementioned evolution caused by the in-breeding with an emphasis on speed vs. stamina. Indeed, it appears that we have gotten to a point where most of the first rate horses never run a race as long as the Belmont Stakes in their entire racing career anymore. This suggests older years are more likely to present us with the so called “Stayers” that pack the kind of stamina an ideal thoroughbred should possess at the starting gates of Belmont Stakes.
The remaining variables center around the Kentucky Derby performance of the horse. Many believe that asking for the modern thoroughbred to race against top competition 3 times in 5 weeks is too much — perhaps even dangerous. That is why the recent years have turned the strategy of skipping the Preakness to have a better shot at Belmont into a very popular undertaking for the trainers and owners of these man made modern speed demons. In this regard, our model may be pointing out to the efficacy of this approach with a number of performance measures from the first leg of the Triple Crown. In contrast, there is only a single Preakness performance related measure further pointing out to the lesser middle child status of Maryland’s Preakness.
PREDICTING THE 2015 BELMONT STAKES
Given the rough model construct we just covered, which horse(s) seem to have the best chance to reach the finish line first and make history? Will American Pharaoh be a living legend or will some no name horse spoil the day for horse racing fans once again?
Without further adieu, given the field of 9 entrants, the model predicts the finishing positions as follows:
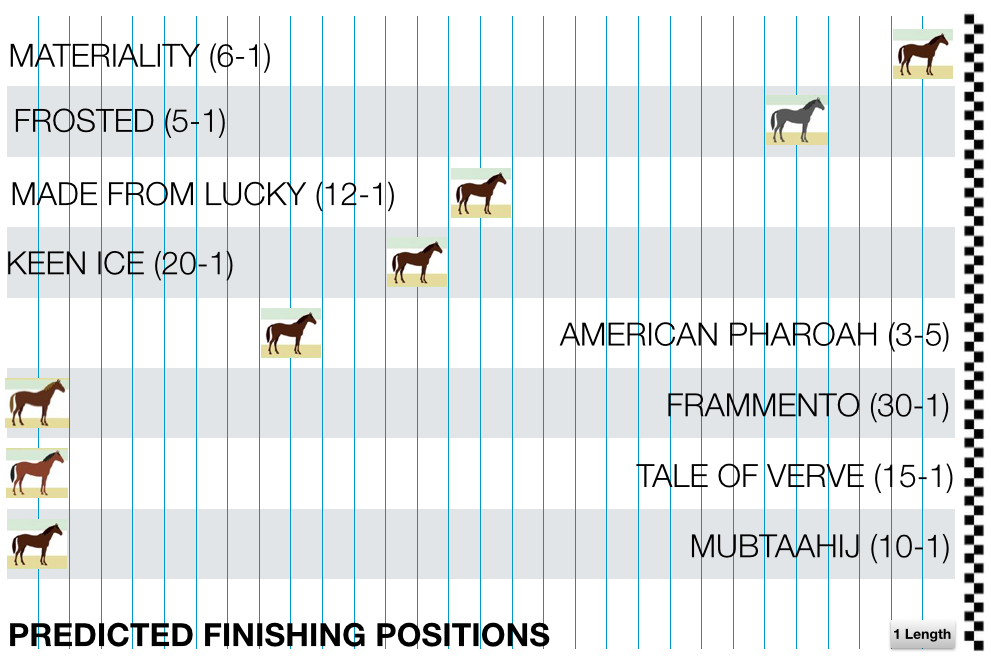
- Win: MATERIALITY (6-1)
- Place: FROSTED (5-1)
- Show: MADE FOR LUCKY (12-1)
- KEEN ICE (20-1)
- AMERICAN PHAROAH (3-5)
- FRAMMENTO (30-1)
- TALE OF VERVE (15-1)
- MUBTAAHIJ (10-1)
As the prediction goes, American Pharaoh will end up being one more false hope as the next Triple Crown champion, finishing somewhere in the middle of the table and disappointing its fans despite a great overall Triple Crown racing performance. Some experts claim that given this field, American Pharoah is likely to jump ahead early as he did in the Preakness and dictate the pace from then on in the hopes that it can steal the race. In that scenario, it seems that our model is predicting that first Materiality and Frosted and later in the stretch Made for Lucky and Keen Ice can close up on Pharoah’s tired legs having enjoyed a much longer and less stressful preparation before the this final “Test of Champions”. In addition, when we look at the confidence intervals accompanying this most likely scenario, they mostly point out to American Pharoah finishing anywhere from 3rd to 5th never seriously threatening the favored Materiality.
We hope this inspires you to grab a cool drink and catch the Belmont Stakes live or on TV or online this weekend. Horse races can be exhilarating events for a wide audience from youngsters to the retired. These beautiful animals are true athletes in the sense that they can move their 1000 pound masses at speeds approaching 40 miles per hour (65 km/h) across a dirt track all the while dealing with equally talented equine rivals looking in their eyes stride by stride. We sure hope thoroughbred racing in America gets to capture its former glory and becomes cherished events beyond the Triple Crown races. Who knows? Perhaps Machine Learning gets to play a small part in that!

Great article atakancetinsoy.
Here in Australia it is getting a lot of attention, we are all hoping the Triple Crown is won.
I was there when Ill Have Another was scratched the day before 😦
apparently the machine has some more learning to do…
it’s an art, not a science
Apparently the “historical” statistics had little bearing on the outcome today-thankfully!!
American Pharoah ran on to Triple Crown victory and left NO doubt!! Time to re-work the “SCIENCE” of predicting CHAMPIONS. Pharoah’s level of excellence does not lend itself to simple analysis. The factors leading to greatness run much deeper…
That said, thanks for the effort 😉