Bad things happen, but thankfully they tend to happen rarely. For example, you’d expect a small fraction of network traffic to be hackers, and a minority of patients to have a serious disease. (I was going to add that we expect a small percentage of credit card transactions to be fraud, but these days that feels a bit optimistic.) We obviously want to identify and avert these rare bad events, and anomaly detection—which BigML just launched last week—is a powerful way to achieve this.
In the disease category, there’s a well-known dataset of breast cancer biopsies from University of Wisconsin Hospitals, including measurements from each biopsy and the result of “benign” or “malignant”. Of course, you can use BigML to train a highly accurate predictive model on this labeled data, but that’s almost too easy. So here’s a challenge: what if we remove the labels of “benign” and “malignant”? Can we still find useful patterns in the data?
BigML makes it simple to create a dataset with only the measurements and not the “benign” or “malignant” labels. We then train an anomaly detector on this unlabeled data, and BigML displays the 10 biopsies with the highest “outlier-ness”:
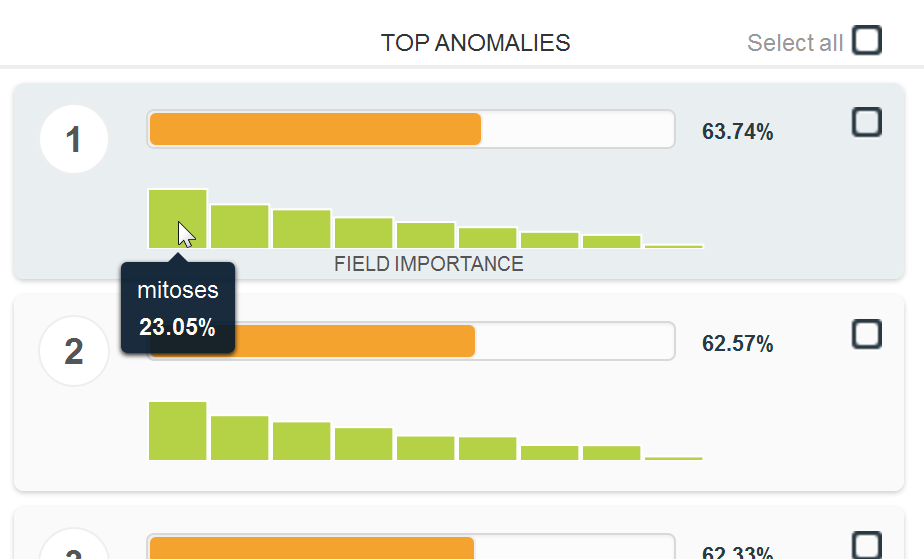
That’s interesting, but I want more insight into what makes a biopsy anomalous. To do this, I create anomaly scores for the entire dataset, give each biopsy a label of “high” or “low” (with “high” defined as the top third of anomaly scores), then train a model to predict this new label. (I’m working on a video for David’s Corner that shows how this all takes just a few mouse clicks—which is exactly what we expect from BigML!)
This new model finds a striking pattern: most high-anomaly biopsies have “uniformity of cell size” greater than 2. Of the 231 high-anomaly biopsies in the entire dataset, a whopping 207 (almost 90%) are covered by this single rule. A higher “uniformity of cell size” means (unintuitively) that the size is less uniform, which is a feature of cancer cells, so experts would conclude that this pattern is worth investigating further.
And they would be right. Because if we let BigML use the labels of benign or malignant, it tells us that biopsies with “uniformity of cell size” higher than 2 are almost always malignant. Think about that: the anomaly detector, having no idea which examples are actually malignant, still managed to figure out that this cell size attribute is important, and specifically that it’s important when it’s greater than 2.
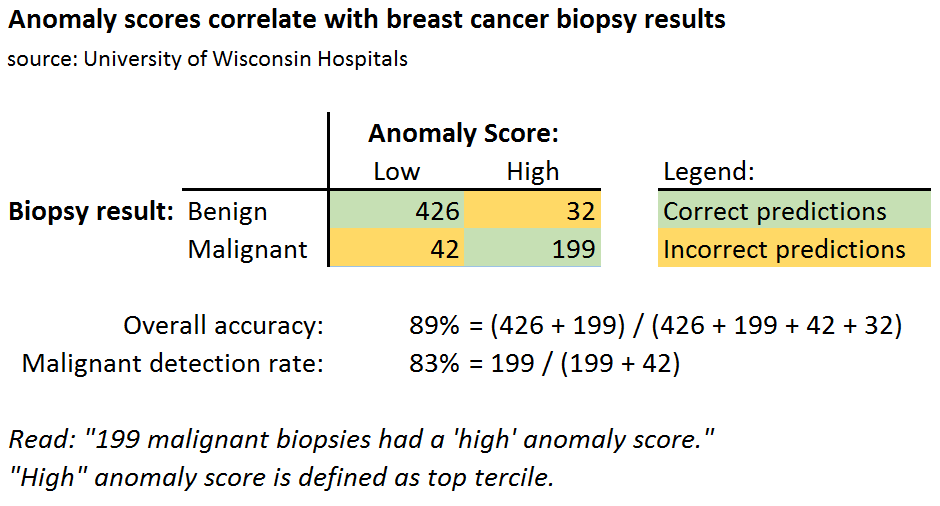
Another way to see the power of anomaly detection is to predict the outcome of a biopsy using only the high/low anomaly attribute. This correctly predicts the result 89% of the time, and detects 83% of malignant biopsies. Again, not bad considering the anomaly detector has no idea which examples are actually benign or malignant!
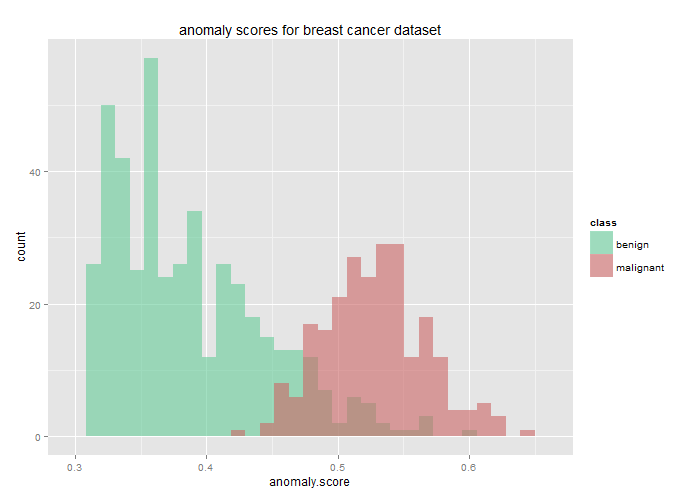
Finally, we can simply compare the histogram of anomaly scores for malignant and benign biopsies. This clearly shows how well the anomaly score lines up with the biopsy results!
Hopefully I’ve conveyed how insanely useful anomaly detection can be for finding patterns in unlabeled data, especially if you expect the data to contain a highly interesting (and often unwelcome) smaller class. This is particularly useful for large datasets where it is not feasible to label all the “bad” examples: millions of credit card transactions, for example, or billions of network events.
Moreover, you expect your adversary—fraudsters, hackers or even cancer—to change tactics over time. Because anomaly detection doesn’t require you to know exactly what you’re looking for, it can pick up on new types of attacks and warn you that something weird is going on.
Anomaly detection is like magic goggles for your data, helping you find patterns in a completely automated and unsupervised way. Of course, it’s not really magic: we’re just reaping the benefits of assuming, correctly, that there is a minority class to be found. And as long as we have adversaries, that will continue to be a good assumption.
For serious data enthusiasts, here are the ingredients for this analysis:
- The original source data hosted at UC Irvine
- This dataset imported into BigML
- A decision tree on 100% of labeled data
- An evaluation of this decision tree
- The unlabeled dataset that we feed the anomaly detector
- The anomaly detector trained on this unlabeled data
- The full dataset with anomaly score added
- The model trained on this data, predicting if a biopsy is in the upper tercile of anomalies

One comment