
If you haven’t been in a cave for the past several weeks, you may have heard that Twitter has announced plans for an IPO, which reportedly will take place November 15. But Twitter is far from the only IPO that has taken place—and there have been some very notable IPOs recently, including Veeva and Empire State Real Estate Trust this month alone. But leading up to every IPO is speculation on the stock’s Day 1 performance. While Day 1 performance isn’t necessarily an indicator of long-term stock (or company) performance, it is a critical metric for the firms that issue a company’s stock, as well as for institutional and individual investors.
IPOScoop has a service and rating system that aims to predict stocks’ opening day performances. At the core of this is their SCOOP Rating (Wall Street Consensus Of Opening-day Premiums), which ranks stocks from 1 to 5 stars (more details here). Happily for us, IPOScoop provides a comprehensive, historical list of past IPO performances since 2000, and tracks whether they met or exceeded the rating (“Performed”), or if they fell short (“Missed”).
What is the objective of this model?
While many BigML users leverage our platform to analyze stock performance or portfolio blend, we thought it would be interesting to see if there are any underlying factors in IPO data that can be used to assess IPOScoop predictions. You can view and clone the full model here.; and the dataset here.
What is the data source?
We used data from IPOScoop’s historical records, which they make available as an Excel download.
What was the modeling strategy?
As the data provided by IPOScoop was already well-structured, very little transformation was required—but we scrubbed the spreadsheet a bit to make sure that the name of the managers / joint mangers were consistent (e.g., we unified all iterations of “Credit Suisse”, “Credit Suisse First Boston” and “CSFB”). We then trimmed some of the ancillary information, converted the file to a .csv and uploaded it into BigML. Once we had the dataset uploaded, we made sure to modify our text analysis settings to take “Full Terms Only” for the Company name, as well as for the Lead / Joint-Lead Managers.
To help us remember what the star ratings meant, we used BigML’s new in-line editing function to input the meanings for each rating,
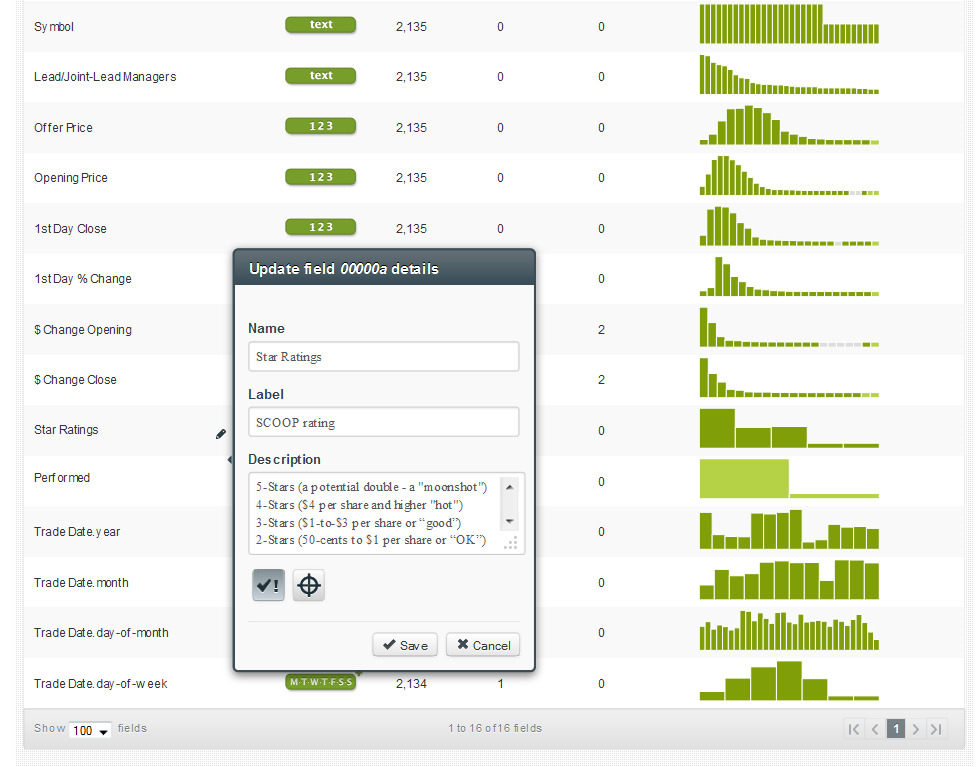
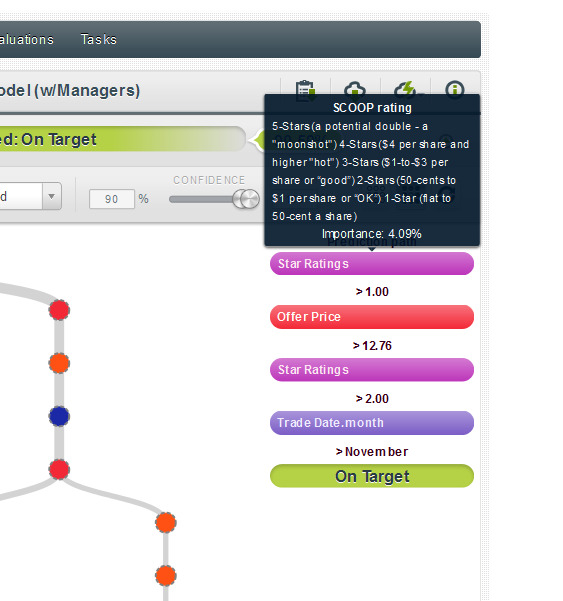
which later appear when we mouse over that field on the right-hand side of the tree..
What fields were selected for this model?
As we wanted to gauge accuracy of the SCOOP estimate, we eliminated all fields that could sway the actual outcome. For example, a large 1st Day Change percentage would naturally lead to a Performed rating so we didn’t use that field. In addition, company name shouldn’t be factored into the findings as we’re trying to predict outcomes independent of the actual entity. In the end, we used the following fields: Trade Month/Date/Day of Week (but not Trade Year), Managers, Offer Price, and SCOOP rating.
What did we learn?
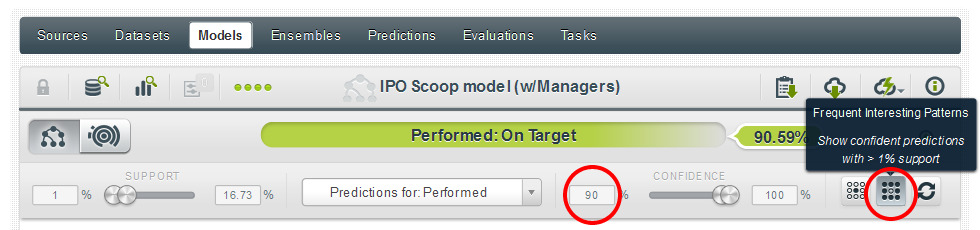
Working in the BigML interface, we used the Frequent Interesting Patterns quick filter to narrow the tree down to highly confident predictions with good levels of support (as an aside, this is the first step I personally take after building any model to get a quick sense for whether it will give me interesting results). And to limit our findings further, we decided to only seek predictions with 90%+ confidence of being on or above target—we did this by dialing the confidence slider up further.
A very important clarification: our confidence levels are not predictions on the actual stock performances; they are predictions on whether the SCOOP ratings will be met (“Performed”) or not (“Missed”).
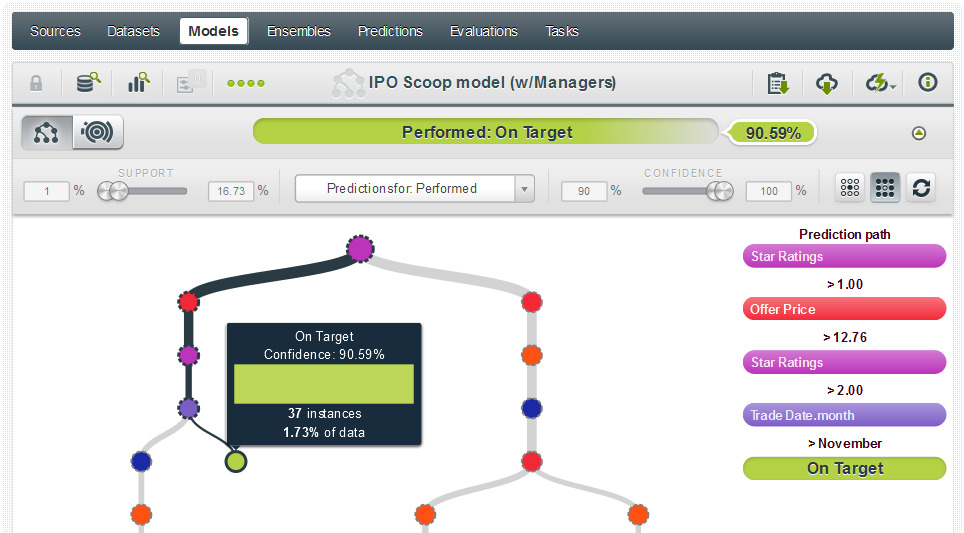
Looking at the tree, we see a quick split at the top based on SCOOP ratings of 1 star (to the right hand side of the tree), and those above one star. This makes sense as to “hit” a prediction the results simply need to meet or exceed the anticipated opening-day result—so a 1-star prediction would be much easier to achieve than a 2+ star prediction. For the purpose of this study, we thought it would be interesting to focus on bolder predictions, so we focus on the left hand side of the tree where we’ll find predictions for stocks with anticipated premiums of at least 2 stars (or $.50 per share).
A few confident nodes jumped out at us:
1) Here we see that we have a 90.59% confidence rating in a Performed prediction for a stock with a star rating of 3 or better and that is issued in December with an offer price above $12.76:
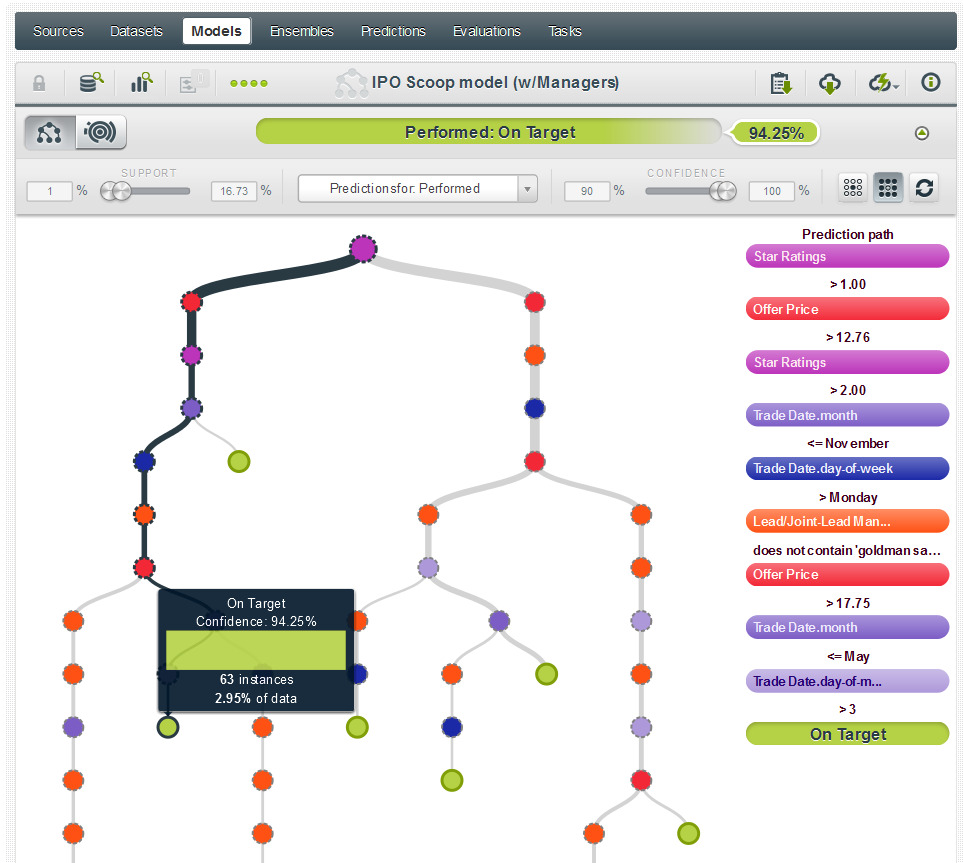
2) Further down the tree, we see that a 3+ rated stock issued after the 3rd day of any month between May and November, on any day other than Monday, with an offer price exceeding $17.75 and that was not managed by Goldman Sachs has a 94.25% likelihood of being an accurate prediction.
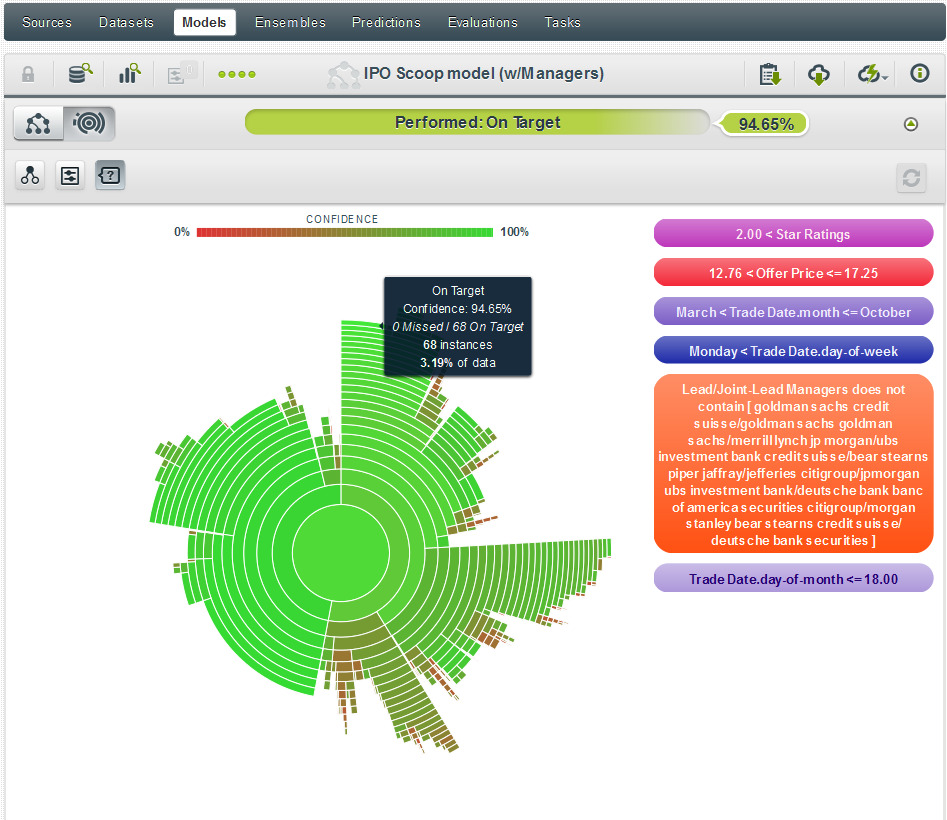
3) As we move even further down the left hand side of the tree we can see another interesting prediction—but this is summarized easier by using the Sunburst view. And as you see below, this prediction tells us that a Performed rating for a 3+ star stock offered between $12.77 and $17.225 that is traded on a Tuesday-Friday before the 18th of any month between April and October and was not managed by one of several firms listed, has a 94.65% confidence of being accurate.
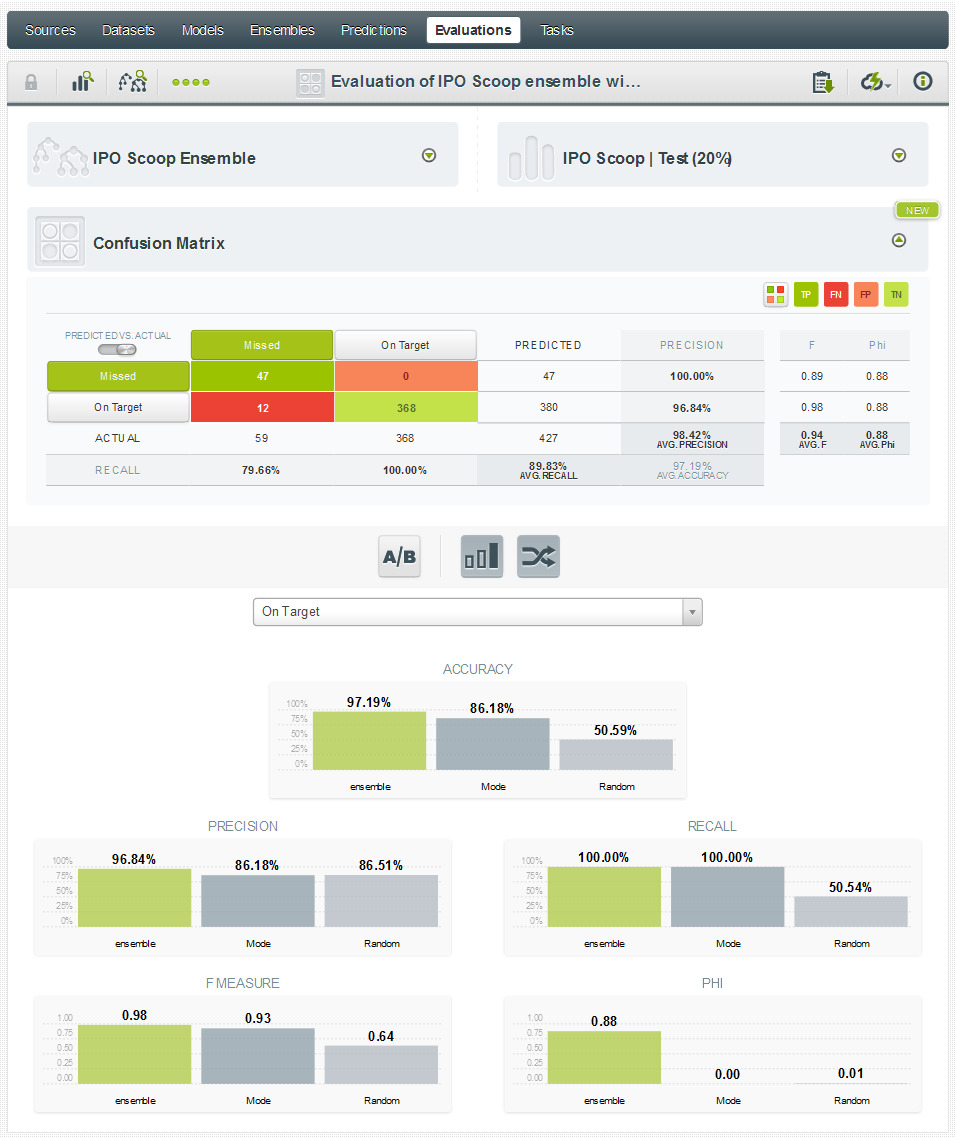
Evaluating our model
To assess the strength of our model, we built a 10-model ensemble, and evaluated it against a 20% test set. The results were actually quite strong, as you can see below:
So what about that Twitter IPO?
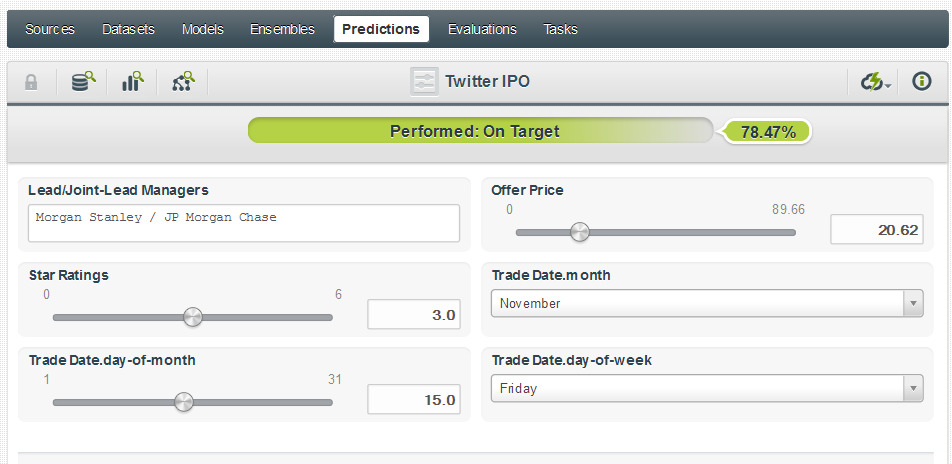
Final details of Twitter’s IPO have yet to be released, but a recent report states the IPO will take place on November 15, with Morgan Stanley & JP Morgan Chase as managers, and with a fair value of $20.62. If we use $20.62 as the offer price and assume a 3-star SCOOP rating, we can build a prediction resulting in in a 78.47% confidence that the SCOOP estimate will be accurate:
Finally, a word of caution..
Needless to say, this blog post isn’t meant to serve as investment advice—we’re simply assessing the likely accuracy of SCOOP ratings, based on a pre-existing dataset. In fact, it’s always good to reflect on a model’s findings and give it your own sanity check. For example, what may the explanation be for the three nodes that we highlight above? In the first instance (the 90.59% confidence prediction), it’s quite possible that this is influenced by the time of year—with major investment funds trying to shore up end of year numbers, which would result in more buyers and an elevated premium. The other two findings? They could just be luck, or perhaps there are other underlying factors that lead to accurate high-performance predictions for mid-year IPOs—added data and added study are always helpful for learning more.
