The issuing of visas for highly skilled workers has been a topic of debate recently in the United States. The H-1B is a non-immigrant visa in the United States under the Immigration and Nationality Act that allows U.S. employers to temporarily employ foreign workers in specialty occupations. Many employers (especially technology employers–most notably Mark Zuckerberg who is backing a lobbying group called FWD.us) want to make it easier for skilled workers to come to the US because they are eager, available and—some would say—generally willing to work for less money.

Recently, our friends over at chart.io did some cool data visualizations working off of an H-1B dataset that they pulled from enigma.io. Frankly, chart.io beat us to the punch a bit as we’ve been sitting on publishing this study until our new text processing feature came out to production, which it did last week. In case you’re not familiar with enigma.io, they’re a great company based in New York that has a subscription service that allows users to search across a vast array of data sources through their web app and provides access to data streams via an API.
What is the objective of the model?
With such a rich dataset we anticipated that taking a multivariate view of the data may uncover some interesting correlations. More specifically, we wanted to see if these correlations could be used to predict the wages of visa recipients. In addition, we thought it would be interesting to see if there are some correlations between job attributes and job location.
What is the data source?
As mentioned, we used enigma.io to get this data. engima.io sourced the data from the Office of Foreign Labor Certification. We pulled a dataset that featured information on every foreign worker application from 2012: 168,717 rows in total, with 37 fields of data. These fields covered information ranging from the visa application itself (when was it submitted? what is the status?) to the visa application’s employer (company name, location) and final parameters about the job itself (occupation classification, title, wage).
What was the modeling strategy?
To narrow the focus of our project, we trimmed the dataset a bit so that it only included approved workers with annual wages (no part-time or contract workers). We also eliminated fields that wouldn’t be relevant to models (e.g., case numbers) or were redundant (there were multiple fields for wage ranges that were largely the same). After our data pre-processing, we still had 151,670 data instances, with 21 fields per row–this was about a 30MB .csv.
What fields were selected for this model?
To focus on wage data, we selected the following fields: status of application, visa class (H-1B, H3-Australian or a few others), employer name/city/state, occupational classification (a high-level description—e.g., “Computer Programmer” or “Aerospace Engineer”), job title, worker city/state, wage, and employment start month.
Later, to focus on identifying the worker’s state, we selected the following fields: status, visa class, occupational classification, job title, worker state, wage, and employment start month.
It’s important to note that city, employer name, occupational classification and job title were all fields that leveraged our new text analysis functionality–which is configurable so that you can optionally:
1. tokenize full terms (e.g., “New York” instead of “New” and “York”)
2. stem words (i.e., ignoring prefixes and suffixes)
3. remove stop words (e.g., “of,” “the,” etc)
What did we find?
Just looking through the dataset histograms were actually pretty informative–even before we built a model. A few things jumped out:
In mousing over the “Wage” histogram, we quickly see that most people make less than $90,100.

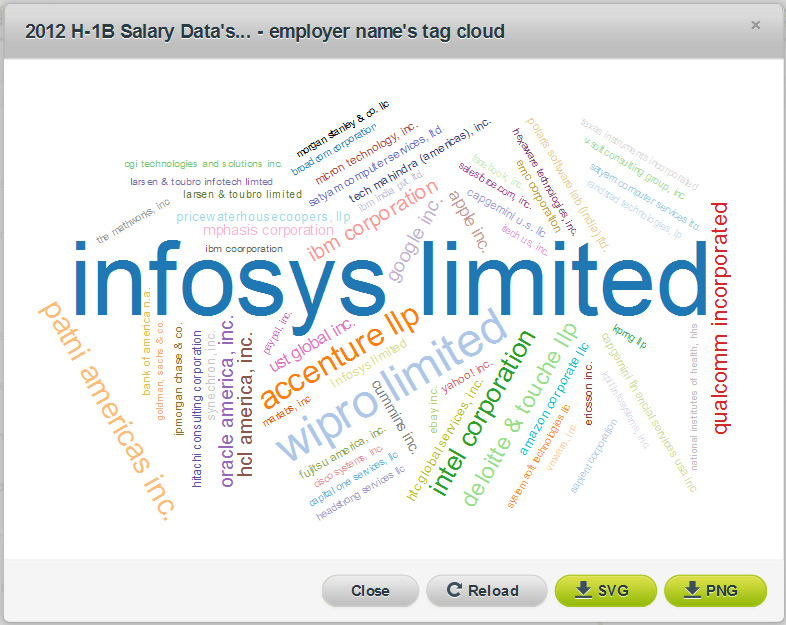
In using the new “tag cloud” summary associated with every text field, we can see that Infosys was the most frequent employer of foreign worker visa recipients, followed by Wipro, Microsoft and several others:
And we can also see from the “Job Title” word cloud that most of these workers are filling technically oriented positions:

After we built our “wage” model from this dataset, we found that Occupational Classification and Job Title were the two most important fields—it’s a good thing that we now support text analysis!:

Interacting with the tree was informative in and of itself. To narrow our focus further, we decided to use the filters in the interface to find workers who made between $100K-$200K per year, and we also capped the expected error at $50K:

One finding here was that a computer software worker for Facebook who’s title does not contain “senior”, “architect” or “principal” had an annual salary of around $103K in 2012 (no word on their stock options, though!):

We also wanted to look at lower-waged foreign workers. When we moved the filter to focus on people making less than $50K in annual wages, we found this interesting node of a Deloitte & Touche employee with an accounting-related job (with ‘senior’ in his/her title) who had a salary of around $47K:

These were just two of many interesting findings. We also ran some predictions against this model and found that terms such as “engineering” for the occupation field led to higher predicted wages across states.
But on to our second model, which was to see if we could predict a worker’s state, based on other data. As mentioned, we looked at fields that wouldn’t give away state (including city name, employer name, etc). This was a bit trickier when using our standard trees as there weren’t many confident predictions that jumped out at us. But this is where the Sunburst View came to our rescue—we found interesting, confident predictions that software engineers making around $72K would reside in Washington State:

And then another, predicting with near 99% confidence that a computer analyst making around $52,000 would be working in Texas:

Conclusion:
Working through this foreign worker data gave us a much better feel for the underlying trends and information–and text analysis was the key for getting greater levels of insight.
Check out the dataset, wage and state models for yourself and let us know what you think!

Blogged here http://phd.tripos.biz/?p=329 in the context of screenplay analytics.
See text cloud generated from BiGML of Alient script blogged here http://phd.tripos.biz/?p=329