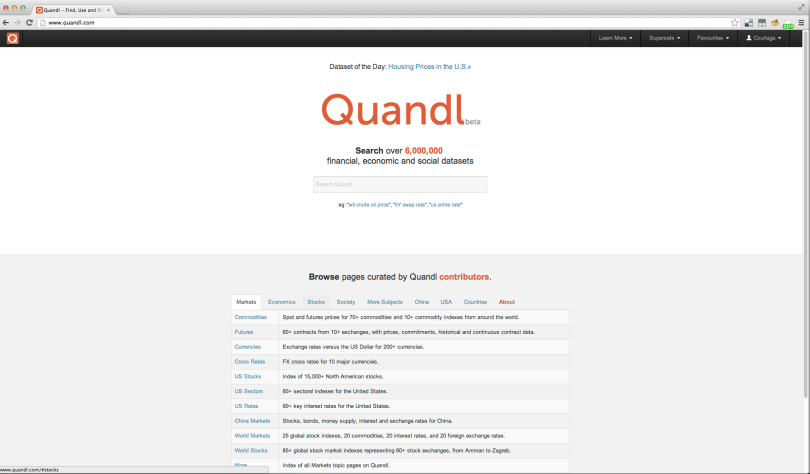
Quandl is a huge repository of financial, economic and social datasets. Registration and use of Quandl is currently, and will always be free. Quandl can be used on the web and/or through a public API.
Most of Quandl’s datasets are univariate, which provide interesting insight and lend themselves to interesting time-series forecasting models. In addition, there’s a great utility in which you can combine columns from different datasets to create a more complex item called a Superset. BigML works very well with these multivariate Supersets.
You can choose several columns from different datasets, and build a custom Superset. If the frequencies in your Superset are different (e.g., if one column tracks data monthly, while the other does daily) the Superset will normalize your data, adjusting to the lowest frequency (e.g., monthly instead of daily).
Creating a Superset
1. Locate the different datasets that contain the columns you want to add to your Superset:


2. Right click on the column header, and add the column to an existing Superset, or create a new one when adding the first field.
3. Be sure to check the fields’ frequency, because the final Superset frequency will be the lowest frequency of all the fields added.
See below a screenshot from a sample Superset, created from several datasets about economic and demographic indicators in the United States.

Use your Superset in BigML
Once the Superset is created and columns are renamed with the desired labels, we can proceed in one of four different ways to upload the result to BigML:
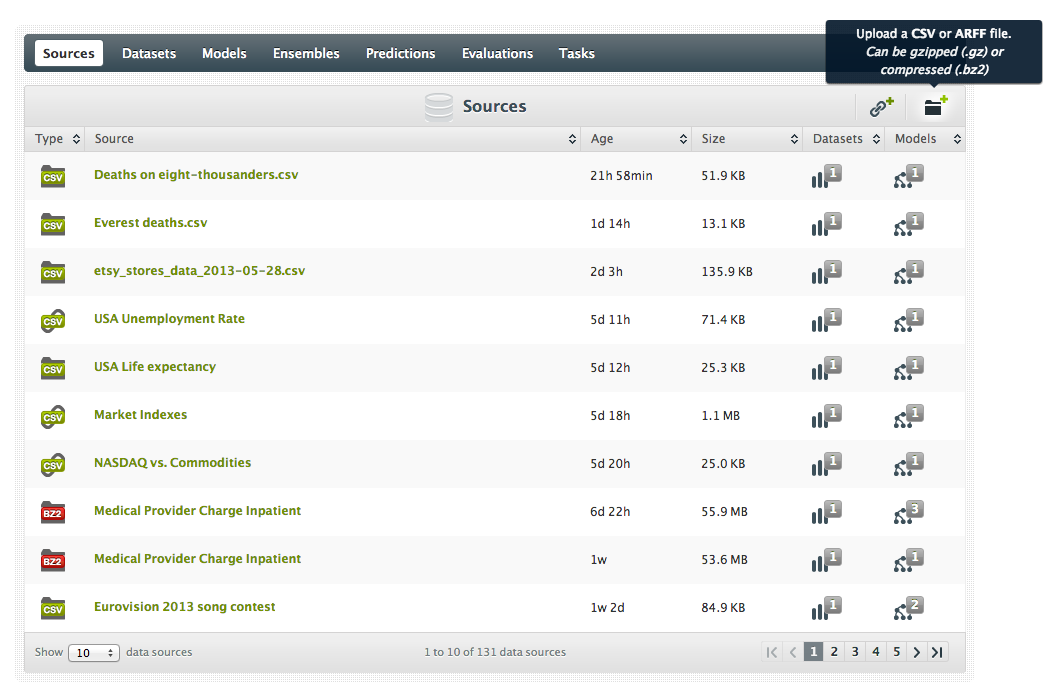
- Click on Download button in Quandl and export as .CSV. This file is now ready to be uploaded to BigML as new Source. (For details on how to upload files into BigML, please visit here, and follow the links to our helpful videos)

- Get the direct link, by clicking the “show API call” in the Download modal window within Quandl, below the Download Data button.
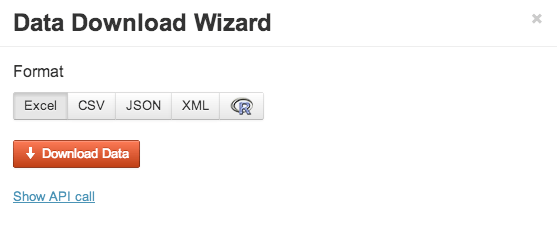 Then use this link as external source in BigML:
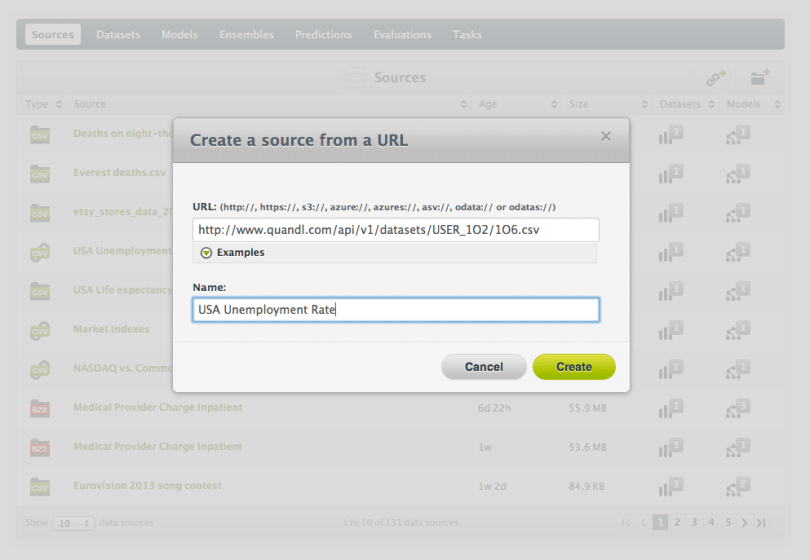
- Or use the Quandl link to upload the source using our public API:
curl --silent https://bigml.io/source?$BIGML_AUTH \ -X "POST" \ -H "content-type: application/json" \ -d '{"remote": "http://www.quandl.com/api/v1/datasets/USER_1O2/1O6.csv", "name": "USA Unemployment Rate"}' - Or you can upload the Source, generate the Dataset and create the Model directly with a single bigmler call (be sure to put the objective field at the end):
bigmler --train "http://www.quandl.com/api/v1/datasets/USER_1O2/1O6.csv" \
        --name "USA Unemployment Rate" --tag "US Indicators"
[2013-05-25 03:29:11] Creating source.
[2013-05-25 03:29:22] Source created: https://bigml.com/dashboard/source/51a013e9925ded36f4000103
[2013-05-25 03:29:22] Creating dataset.
[2013-05-25 03:29:25] Dataset created: https://bigml.com/dashboard/dataset/51a013f1925ded36f3000310
[2013-05-25 03:29:25] Creating model.
[2013-05-25 03:29:31] Model created: https://bigml.com/dashboard/model/51a013f5925ded36f3000314.

Generated files:

SatMay2513_032911
├─bigmler_sessions
├─dataset
├─models
└─source


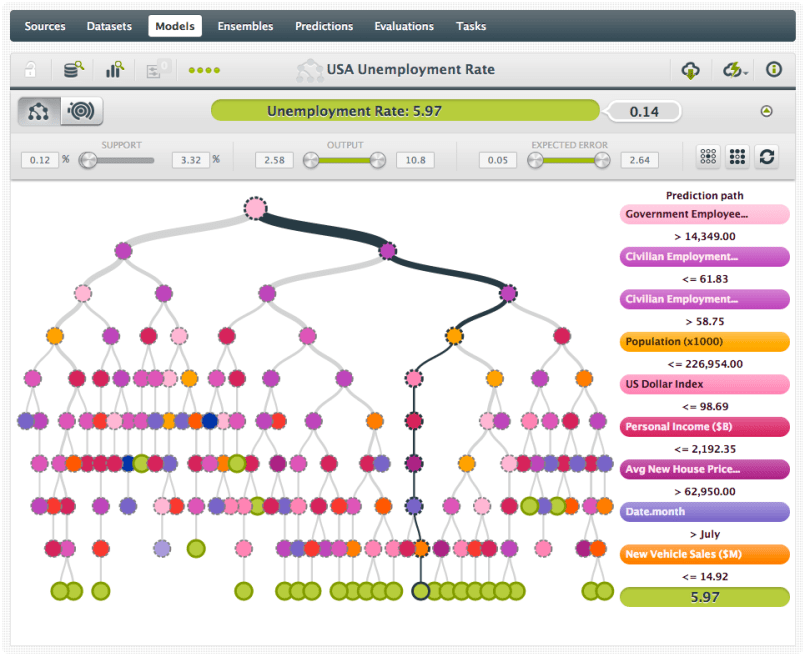
And finally the model is created in BigML. In the view below the decision tree visualization has the unemployment rate as the predicted field. In this case, unemployment is predicted at 5.97%, based on the fact that there are less than 14,549,000 government employees, the civilian employment ratio is between 58.75%-61.83%, population is less than 226,954,000, the US Dollar index is lower than 98.69, personal income is less than $2.192B, the average new house prices is greater than $62,950, the month is later than July, and monthly new vehicle sales are less than $14.92M.
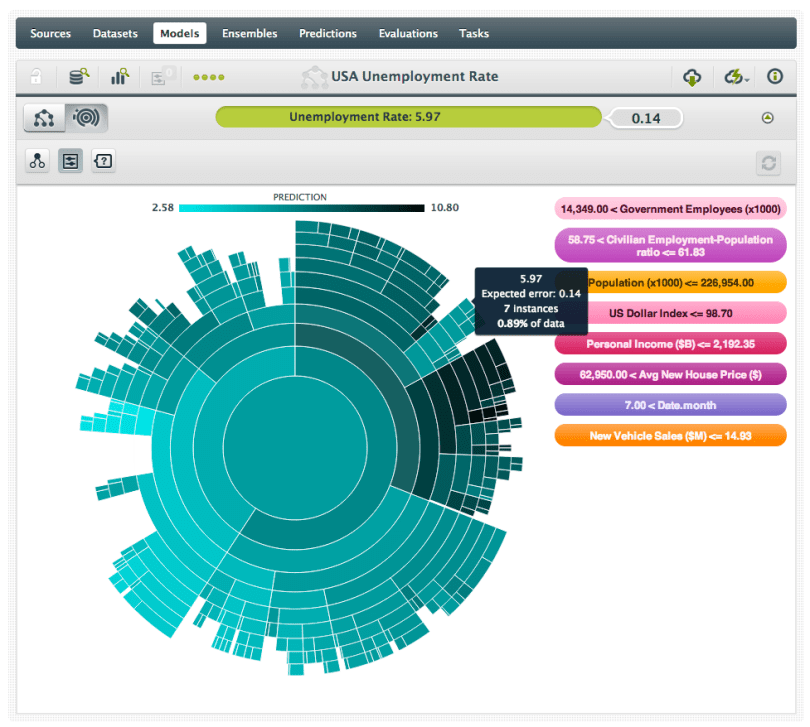
You can also analyze your model using BigML’s sunburst visualization—which has three viewing options: Split Field, Prediction and Confidence. Shown below we see the same finding (from the decision tree above) in the Prediction view, where darker means a higher result.
We’re just getting started in this collaboration with Quandl—stay tuned for more updates and innovations! In the interim, if you build a model with a Quandl superset, please let us know.

5 comments