If you are one of the approximately 54 million Americans that filled out a bracket to predict the NCAA Men’s Basketball tournament this year, odds are that your bracket was no longer perfect within the first 24 hours of tournament, and substantially off track by the end of the opening weekend. Correctly predicting all 63 games (ignoring the 4 play-in games) is infamously difficult, with a probability that ranges from 1 in 9.2 quintillion to a much more manageable 1 in 128 billion, depending on who is counting. With such low odds, it is no surprise that Warren Buffet had famously offered a $1 billion prize to anyone who correctly picks every winner.
Not familiar with how the NCAA basketball tournament works? Now is a good time to pause and check out this guide.

This year, the tournament once again lived up to its “March Madness” moniker with a number of heavy favorites losing in the first two rounds of the tournament. The chaos was headlined by an unprecedented upset of #1 overall seed Virginia in the first round by long shot UMBC, and also claimed #1 Xavier, #2 North Carolina, and #2 Cincinnati as victims. With so many brackets officially busted, we decided to investigate how a Machine Learning approach would perform on predicting the remainder of the tournament.
Data Collection and Feature Engineering
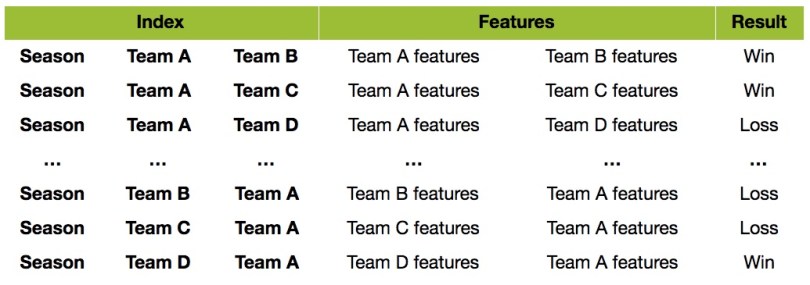
In nearly all data analysis projects, data acquisition and wrangling constitute the greatest challenge and time demand. Fortunately, a well-structured data set of NCAA basketball games – extending back to the 1985 season – has been compiled by Kaggle and Kenneth Massey. While this data was not in a format that could be considered “Machine Learning-ready” it did provide substantial raw material to engineer features. Our approach was to represent each team as a list of these engineered features, such that each past basketball game could be represented by the combination of two lists (one for each team), and an objective field consisting of the result of the game from the perspective of the first team listed. Because so many of our features relied on data that was only collected going back to the 2003 season, we limited our final data set to 118 total features acquired from the most recent 15 seasons.
The features used in this investigation belonged to several different categories:
- Team performance: e.g., home/away wins, wins in close games, longest win streak, scoring differential, etc.
- In-game statistics: e.g., free-throw percentage, three-point field goal percentage, average three-point field goal attempts, average rebounding difference, etc.
- Ranking information: e.g., RPI, tournament seeding, Whitlock, Pomeroy, Sagarin, etc.
Model Training and Evaluation
Operating under the assumption that each season can be considered independently, we trained and compared four distinct supervised Machine Learning algorithms offered by BigML using historical NCAA tournament and regular season data going back to 2003. Using the Python bindings, a unique cross-validation approach was implemented in which the results for each tournament were predicted using games from all other tournaments as training data. Given that 15 seasons of training data was available, the resulting evaluation was analogous to a 15-fold cross validation, which is visualized in the boxplot below. Default parameters were used for each of the four algorithms investigated: random decision forests, boosted trees, logistic regression, and deepnets.
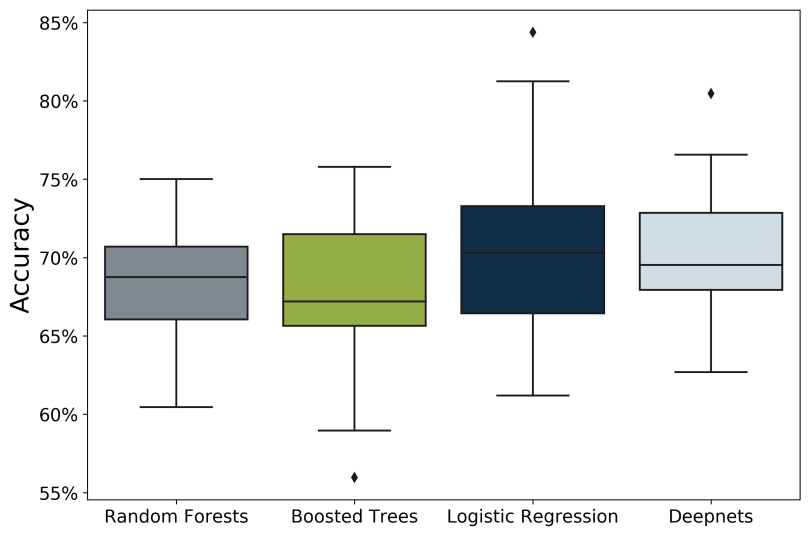
While these algorithms performed similarly to one another, we ultimately decided to apply our deepnets implementation since it had the smallest variance season-to-season and the greatest minimum performance, that is, it rarely performed poorly relative to the other methods.
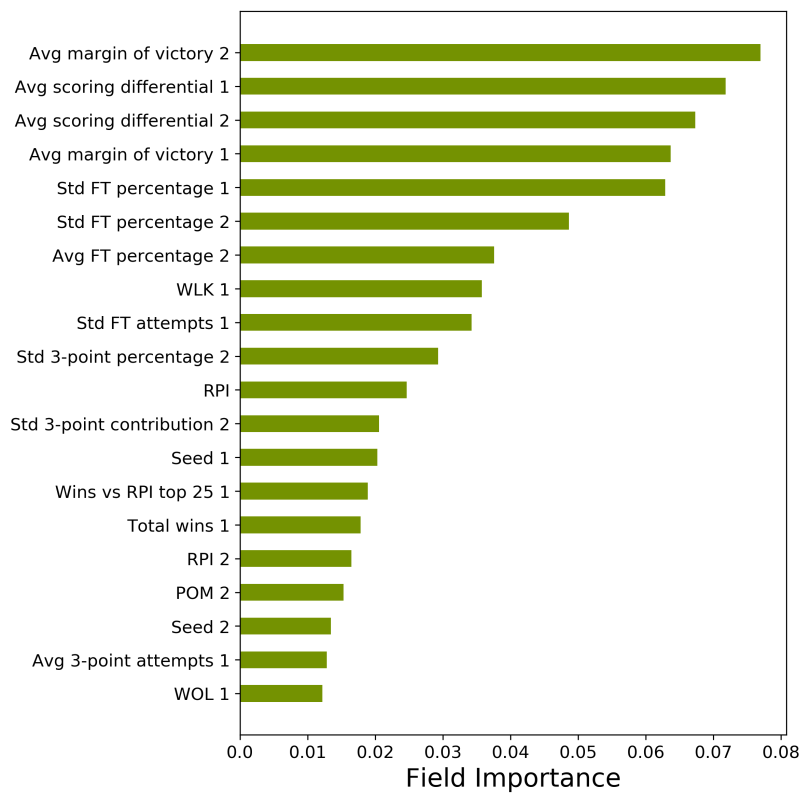
When investigating the field importance of the model, interestingly the team seed was not the most important feature, although both ranked in the top 20. This indicates that our model will return predictions that consider more than simply the seeding in the tournament. The top four features were quite consistent: the average scoring differential and margin of victories for the respective teams. This result suggests that how many points you score relative to the competition is perhaps a greater indicator of future wins than simply whether or not you have won in the past. Accordingly, teams with many blowout wins likely perform better than teams that have equivalent records but have won by narrower margins. The absence of “close wins/losses” among the top features indicates that close games may be decided more often by chance than by determination.
Finally, a number of different ranking systems, including RPI, WLK (Whitlock), WOL (Wolfe), and POM (Pomeroy), were found among the top features. It should be noted that while each of these systems uses a different methodology to rank teams, they are very highly correlated with one another as well as the seeding in the tournament. If interested, you can check out an exhaustive list of these different ranking systems and how they compare.
Deepnet Bracket Prediction
Filling out an NCAA tournament bracket certainly does not require an algorithm, and several popular heuristics exist which enjoy varying degrees of success. While some combination of gut instinct, alma mater loyalty, and even mascot preference inform most bracket decisions, the default method of selection is simply choosing the lower seed. While this pattern largely held in our machine learning-generated predictions, the efficacy of this method breaks down after the initial rounds pass and teams become more equally matched. In a typical bracket contest, these are also the rounds worth the greatest amount of points.
In addition to picking the winner of each match-up according to our model, we have also color-coded the probability of each team winning. The intensity of color represents the probability of the result, with upsets being colored in red and pale colors indicating low confidence in an outcome.
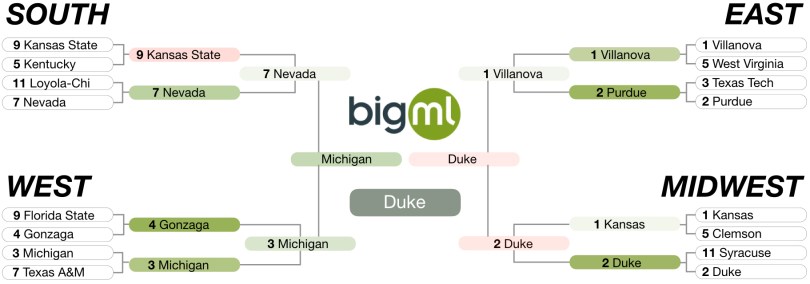
While conservative overall in its predictions, our model does not always choose the lower seed. In the East and Midwest, Villanova and Duke are expected to advance to the Final Four, although both Elite 8 match-ups are predicted with confidence not much higher than a coin flip. In the South, our model prefers #9 Kansas State over lower-ranked Kentucky, although Nevada is picked to advance to the semi-finals. Finally, in the West Region, our deepnet model has considerable confidence in Gonzaga and Michigan advancing, and prefers Michigan overall. Our projected championship game is a match-up between Big Ten tournament champion Michigan and perennial contender Duke, with the Blue Devils emerging victorious on April 2 for their 6th national title.
Tournament Simulations
While predicting the discrete outcome of a match-up is a compelling exercise, the frequency of upsets in the NCAA tournament reminds us that even very rare events inevitably occur. The next step was to explore the probabilities returned by our model in greater detail.
Rather than simply assuming the higher-probability result would always occur, we can instead simulate each game as an “unfair” coin-flip, according to the match-up probabilities returned by our model. That is, if Villanova is likely to defeat West Virginia with 73% probability, there is still a considerable chance (27%) that West Virginia may advance. By simulating tournament games in this manner, we can introduce upsets into our predictions according to how likely they are to occur. In the end, we simulated the remaining games of the tournament 10,000 times. The results are summarized in the table below.
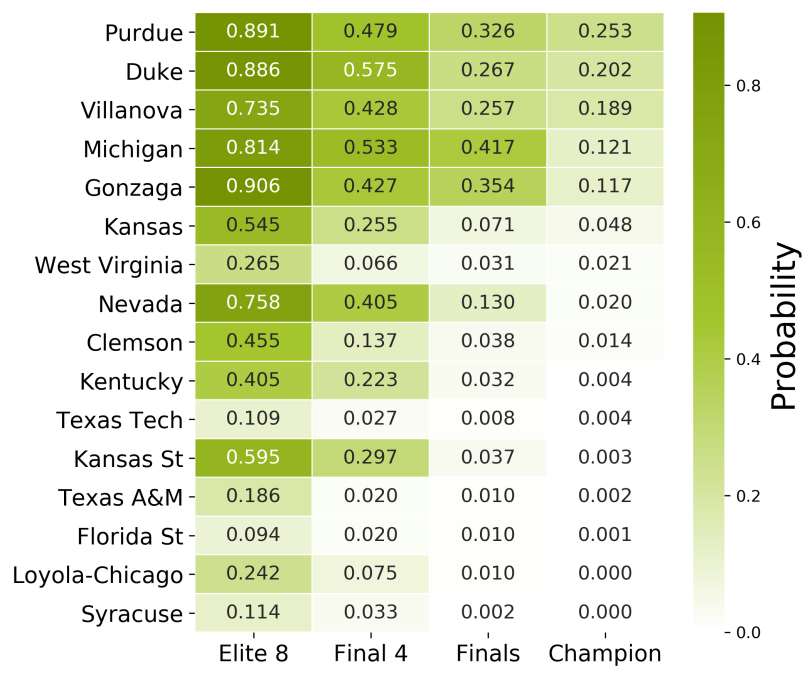
Because the probability of events in the later rounds of the tournament represent compound probabilities, we see results that at first glance may not seem consistent with the bracket produced above. For instance, although Villanova is favored over Purdue in a head-to-head match-up, Purdue* still has the highest probability of winning the entire tournament. This is a reflection of two factors:
- Purdue being more likely to advance out of the Sweet 16 round than Villanova.
- Differences in results with the other teams in the tournament that could be faced in the Final Four rounds.
*Unfortunately, our model does not have the sophistication to factor in injuries to key players at this point, nor was it updated with data from the first two rounds of the tournament. Many experts agree that Purdue’s chances have taken a significant hit following the injury to 7-foot-2 center Isaac Haas, unless Purdue engineers can save the day.
Final Thoughts
While relying on a Machine Learning model to predict a bracket is far from a sure strategy, it can provide an alternative method to make interesting and compelling picks. By emphasizing the probability of the events, rather than the discrete outcomes, we can get a better sense of the frequency of upsets. Ultimately, the only way to know who will win the tournament is to play the games.
