Anomaly detectors are a useful tool for any machine learning practitioner, whether for data cleaning, fraud detection, or as early-warning for concept drift. While there are many algorithms for detecting anomalies, there is a lack of publicly available anomaly detection benchmark datasets for comparing these techniques.

This is what our Chief Scientist, Professor Tom Dietterich, and his research group at Oregon State University set to remedy with their paper ”Systematic Construction of Anomaly Detection Benchmarks from Real Data”. They devised a way to sample real-world supervised learning datasets so that they produce benchmarks that vary along three dimensions: point difficulty, relative frequency, and semantic variation. This blog post won’t dive into the details of those dimensions. But it lets us push the anomaly detectors to their limits in a variety of ways, giving us a robust set of tests for comparison. The benchmark datasets will have points labeled as “anomalous” and “normal”, so the detectors can be scored against them (specifically AUC).
Using the flexibility of WhizzML (our LISP inspired DSL for Machine Learning workflows), BigML has replicated their process. With the click of a button, a single supervised “mother” dataset can generate hundreds of children datasets defined by these dimensions and ready for benchmarking.
Before we generate these children datasets, however, we need to label some of the rows as “anomalous” and some as “normal”. This is the fundamental operation in transforming a supervised learning dataset into a anomaly detection benchmark. But how should we split the dataset? If a dataset has a numeric objective field, we can simply test whether the objective value is above or below the median; labelling one side as “anomalous” and the other “normal”. For binary classification tasks it’s even easier. One objective field value is chosen as “anomalous”, the other as “normal”.
Things are a bit more complicated if our objective has multiple classes. We could arbitrarily group classes into two sets and make those “normal” and “anomalous”. But we want to make our benchmarks datasets hard on our anomaly detectors. We can do this by ensuring that both the “normal” and “anomalous” groups have a diversity of classes assigned to them. In other words, we want to make sure that very similar classes are assigned to different groupings.
So how do we go about defining class similarity and assigning the classes to our “normal” and “anomalous” groups? To illustrate, let’s say we have a 10 class problem where the classes are recognizing handwritten digits (like MINST).
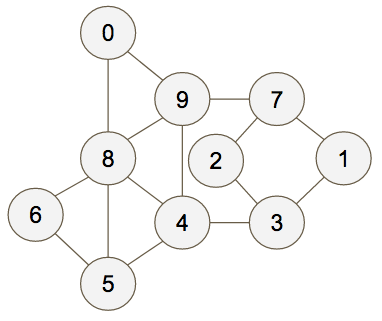
First we first train a model on part of the dataset and make an evaluation on the remaining portion. We use the confusion matrix from that evaluation to create a graph with edges that represent the confusion between each class. That is, each node of the graph is a class and each edge weight represents how often the classes were mistaken for each other. For our MINST-like example, we’d might end up with the graph below.
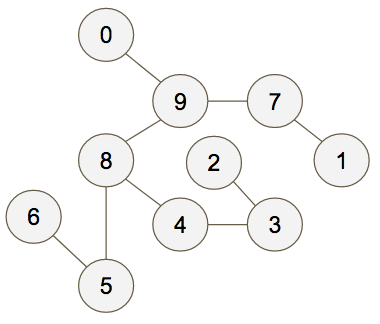
Now we create a maximum spanning tree for the graph:
And finally we two-color the graph to create our “anomalous” and “normal” groups:
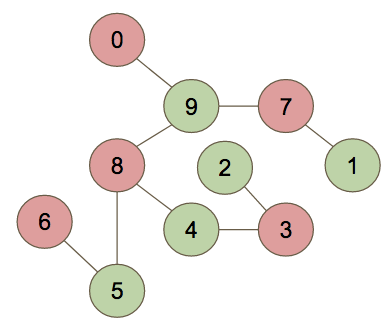
By partitioning the graph this way, we’re helping to maximize the difficulty of our benchmarks. Hard to differentiate classes (frequently mistaken for one another) will be placed in separate groups.
This is only part of the overall process for generating benchmarks (our full implementation is here). But now that we’ve introduced this, we want to walk through the WhizzML function for finding a maximum spanning tree. It’s a good example of the flexibility WhizzML offers when building Machine Learning workflows.
WhizzML has no native graph object, so to do this we defined a graph as a map with keys “nodes” and “edges”. The value of “nodes” is the list of classes, and the value of “edges” is a list of edge maps, with keys “ends” (an ordered pair of nodes) and “weight” (the sum of the values found from the confusion matrix). Using a form of Kruskal’s algorithm we can find the maximum spanning tree. Here is the WhizzML implementation:
(define (max-span-tree graph)
  (let (edges (get graph "edges")
        nodes (get graph "nodes")
        sorted (reverse (sort-by-key "weight" edges))
        find-subgraph (lambda (node-id subgraphs)
                        (let (parent (get subgraphs (str node-id)))
                          (if (= parent -1)
                            node-id
                            (find-subgraph parent subgraphs)))))
    (loop (span-edges []
           subgraphs (make-map (map (lambda (x) (str (get x "id"))) nodes)
                              (repeat (count nodes) -1))
           list-of-edges sorted)
      (cond (= (count span-edges) (- (count nodes) 1)) span-edges
            (empty? list-of-edges) "Graph is disconnected"
            (let (edge (head list-of-edges)
                  rest (tail list-of-edges)
                  ends (get edge "ends")
                  subgraph1 (find-subgraph (head ends) subgraphs)
                  subgraph2 (find-subgraph (last ends) subgraphs))
              (if (= subgraph1 subgraph2)
                (recur span-edges subgraphs rest)
                (recur (append span-edges edge)
                       (assoc subgraphs (str subgraph1) subgraph2)
                       rest)))))))
Like many WhizzML scripts, the first line is the name of the function (max-span-tree) and the variables it takes (graph, a graph of the form just discussed). The next series of lines are the let statements, where variables just used in this function are created. We define “nodes” and “edges”, which are just the keys of the graph, then we define “sorted” as the edges sorted highest to lowest by weight. Since the sort function does smallest to largest by default, we need to reverse the list. Lastly, we define “find-subgraph”, which is itself a function.
Now we get to the meat of the script. It is a loop that takes three inputs (span-edges, subgraphs, and list-of-edges). The loop contains a conditional statement. If span-edges is one smaller than the number of nodes, then we are done and we return span-edges. If the list-of-edges is empty, the graph is disconnected and we can’t make a maximum spanning tree. Otherwise, if the ends of the first edge in the list-of-edges are part of the same subgraph, do the loop again with the tail of list-of-edges. If they are in separate subgraphs, do the loop again after adding that first edge to the span-edges, updating your subgraphs, and taking the tail of list-of-edges. Follow the Wikipedia link for a nice picture of the process.
This script demonstrates WhizzML is more than just a scripting language. It is a fully formed programming language, capable of doing complex calculations as well as creating and fetching resources. With this power at your fingertips, you can be confident that you can implement cutting edge Machine Learning research.

One comment